WTI Crude Falls $3 This Week After Forming a Bearish Reversal Pattern
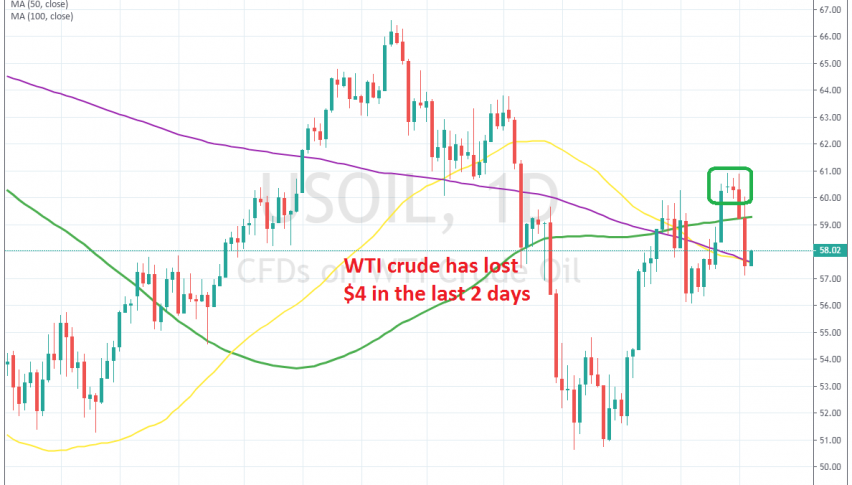
WTI crude Oil broke above $60 last week, but it has turned bearish again now after 2 really bearish days

Crude Oil turned pretty bullish last month after bouncing off the area above $50 which seems to have formed a strong support zone down there. April and May were pretty bearish for Oil due to the slowdown in the global economy in Q2 and the precipitation of the trade war.
But, tensions surrounding Iran and the decision from OPEC+ to extend the production cuts helped crude Oil. US WTI crude jumped around $10 last month and after but found support at $60. The price retraced down in the first week of this month, but the buyers returned and they pushed WTI crude above $60.
In the last two days of last week though, Crude Oil formed two doji candlesticks on the daily chart below $61, which are reversing signals. In the last two days Oil lost nearly $4, falling from $61 to $57. Oil buyers failed to reach the previous top at $66.50s which means a lower high and the reversal in the last two days has been quite swift. This shows that the pressure is on the downside for oil now, and I am thinking of going short on WTI crude at $60 if the buyers manage to push up there again.
- Check out our free forex signals
- Follow the top economic events on FX Leaders economic calendar
- Trade better, discover more Forex Trading Strategies
- Open a FREE Trading Account


