Selling the Pullback in EUR/USD
EUR/USD has retraced higher since yesterday, but the main trend is still down and the retrace is complete now
During June, EUR/USD turned pretty bullish after being on a bearish trend for more than a year. The weak economic data accumulated in recent months and the FED turned dovish, which in turn turned the USD bearish and sent EUR/USD around 300 pips higher.
But the trend ended in the last week of June ahead of the G20 summit, as the sentiment improved for the USD. We saw a bearish reversal that week, which stretched further during July. So, I have had a bearish bias for this pair during this month.
The USD has been gaining confidence as markets are rejecting the scenario where the FED enters another easing cycle, apart from the rate cut planned for this month or the next one. So, I am looking for pullbacks higher in this pair which offer good opportunities for sellers.
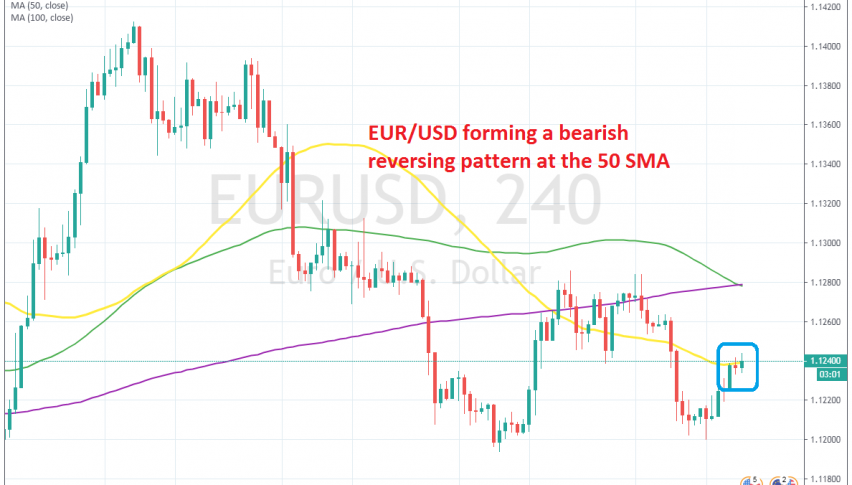
Looking at the H4 chart, we can see that the price has reached the 50 SMA (yellow) which is providing resistance for this pair. The previous candlestick closed as a doji right at the 50 SMA which is a reversing signal. This chart setup points to a bearish reversal, so we decided to open a sell signal here.

The H1 chart is severely overbought
The H1 time-frame is also pointing down; this chart is severely overbought and we see here that it’s the 100 SMA (green) which is providing resistance. We are short on this pair now and the bearish reversal is already happening, so let’s wait for our pips.
- Check out our free forex signals
- Follow the top economic events on FX Leaders economic calendar
- Trade better, discover more Forex Trading Strategies
- Open a FREE Trading Account


