Shorting the Head and Shoulders Pattern on USD/JPY
USD/JPY has moved higher this week, but it has formed a head and shoulders pattern which is pointing down now
[[USD/JPY]] turned bearish at the end of April and lost nearly 600 pips from top to bottom by the end of June. The deteriorating sentiment in financial markets turned the cash flow in the direction of safe havens such as the JPY, which sent this pair lower. But in the last two months, we have seen this pair consolidate and trade mostly sideways.
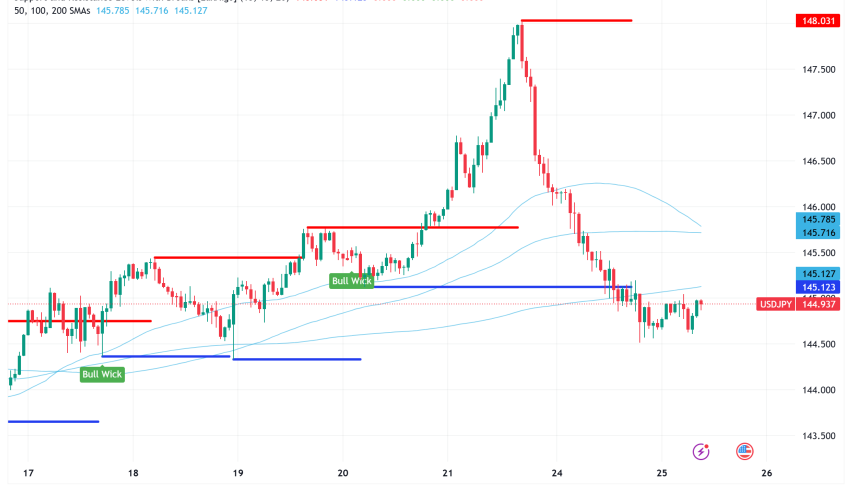
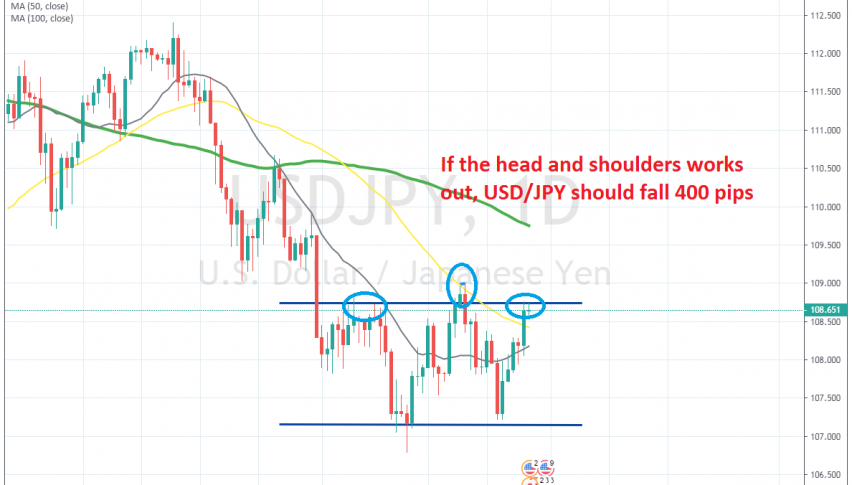
The price has bounced in a range which stretches from 106.80 to 109 on the extremes, but the main body of the range is a bit narrower. In fact, looking at the daily chart above, we can see that a head and shoulders pattern has formed on this pair.
We have a higher top at 109 when this pair reversed at the 50 SMA which is the head, and two lower tops which form the shoulders. This pattern points to a bearish reversal and if it is to work out properly, the decline should be around 400 pips, 200 pips from the head to the neckline, and 200 pips lower from the neckline down. So, we decided to open a sell signal based on this chart pattern, now let’s see if it will work out.
- Check out our free forex signals
- Follow the top economic events on FX Leaders economic calendar
- Trade better, discover more Forex Trading Strategies
- Open a FREE Trading Account