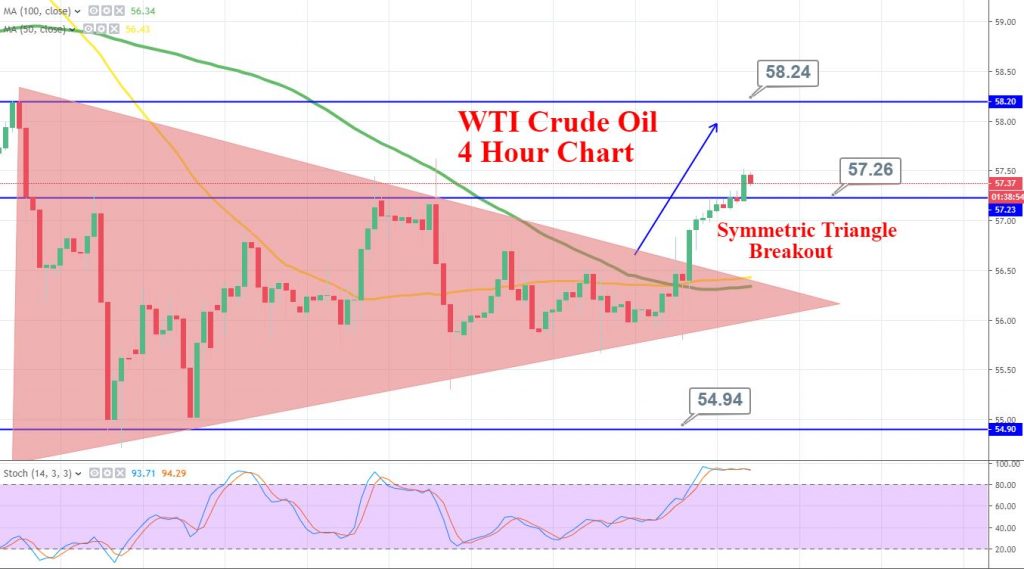
Crude Oil Violates Symmetric Triangle – is it Going After 58.20?
Crude oil gained bullish momentum amid better than expected economic growth in the United States. The 2.1% GDP growth rate strengthened...
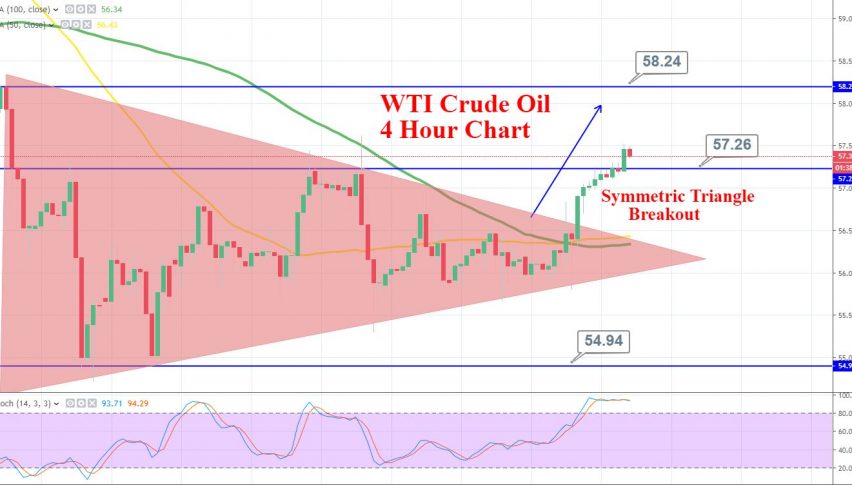
Black crack crude oil finally came out of a symmetric triangle pattern which was extending resistance around $56.70. Most of the buying came over-optimism that the US Federal Reserve will this cut interest rates for the first time in more than 10 years this week. Eventually, underpinning fuel consumption in the world’s biggest oil consumer.
Last week on Friday, WTI crude oil gained bullish momentum amid better than expected economic growth in the United States. The 2.1% GDP growth rate strengthened the outlook for oil consumption but, elsewhere, disappointing economic data has increased concerns about slower growth.
Investors are also eyeing the US and Chinese negotiations as officials from both nations meet for in-person talks for the first time since agreeing to a truce to their trade dispute last month.
Although expectations for progress during the two-day Shanghai meeting are low, investors seem to invest in crude oil to price in the optimistic sentiments.
Support Resistance
56.25 57.52
55.42 57.96
54.15 59.23
Key Trading Level: 56.69
On the technical side, crude oil has violated the symmetric triangle pattern which was extending resistance around $56.70. At the moment, $56.60 is likely to work as a support, while next resistance is likely to be around $58.20. I know it’s pretty far from the current price, which is why I’m hesitating to enter a buy position until we have further confirmation.
Good luck!
- Check out our free forex signals
- Follow the top economic events on FX Leaders economic calendar
- Trade better, discover more Forex Trading Strategies
- Open a FREE Trading Account


