Buying EUR/JPY Off the 100 SMA as it Turns From Resistance into Support
EUR/JPY has been slipping lower but the 100 SMA is providing solid support again, so we decided to go long from there

EUR/JPY has been on a long term bearish trend which started at the beginning of 2018. Although, by the middle of last week we saw a 130 pip jump off the 120 level. That was due to some improvement in the market sentiment which sent safe havens lower, but the big round level at 120 also helped.
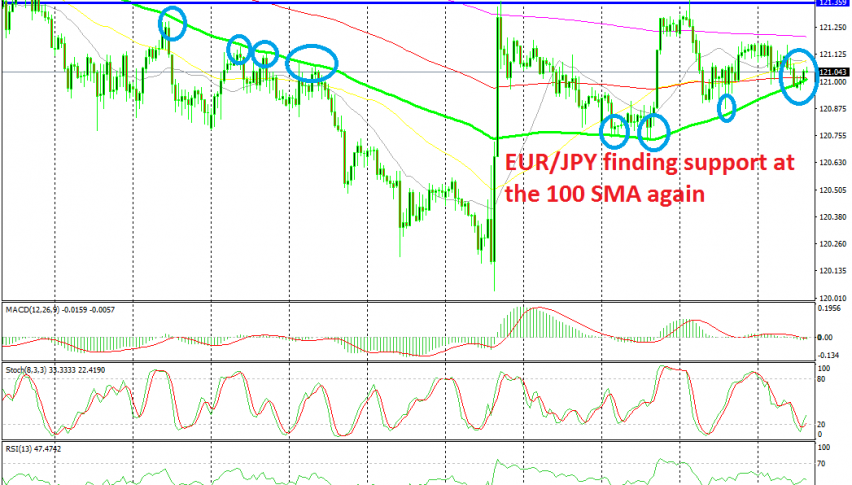
Looking at the H1 chart, we can see that the 100 SMA (green) was providing resistance during pullbacks when this pair was on the way down during the previous days. After it was broken on Thursday, the 100 SMA turned from resistance into support and it has been holding the declines several times since then.
A resistance level has formed as well at the top around 121.30s, so it seems like EUR/JPY is trading in a range. Right now, the price is at the bottom of the range and the 100 SMA is holding the decline as well.
A sort of doji candlestick formed two hours ago on this chart above the 100 SMA which is a reversing signal and the stochastic indicator is oversold, which means that the pullback is complete on this time-frame. So, we decided to open a buy trade on this pair as it is starting to make a reversal higher.
- Check out our free forex signals
- Follow the top economic events on FX Leaders economic calendar
- Trade better, discover more Forex Trading Strategies
- Open a FREE Trading Account


