USD/CAD Falling Down After Forming A Reversing Pattern at the 200 SMA
USD/CAD has been bullish last week, but it is reversing at the 200 daily SMA now
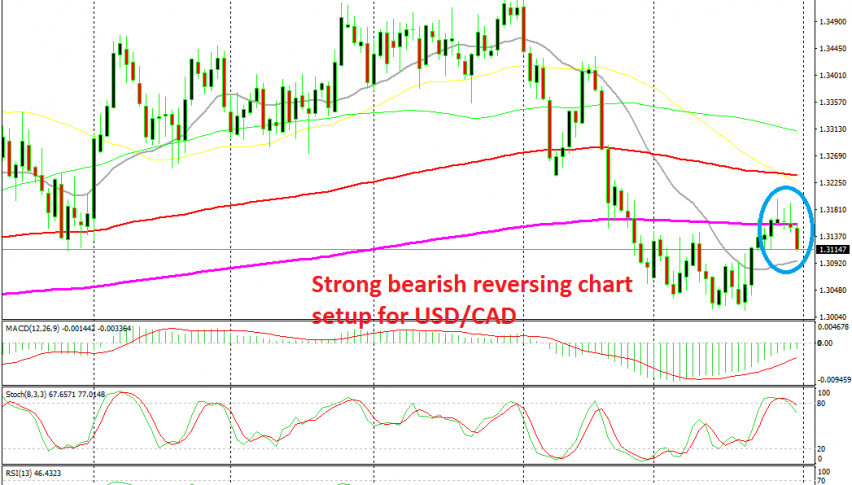
[[USD/CAD]] turned pretty bearish in June, falling from around 1.3560s to 1.30 lows. In the first two weeks of this month though, this pair consolidated above 1.30, so it seems like that big round level formed a support area around it. Last week, USD/CAD turned bullish again and climbed pretty close to 1.32.
Buyers pushed above the 200 SMA (purple) on the daily chart, which used to provide support last year and it did provide support for a few days at the end of last month when this pair was on the way down. But the price returned back below it today, so it seems like this moving average has turned from support into resistance now.
The price formed two upside down hammer candlesticks and a doji, all of which are bearish reversing signals. The stochastic indicator was also severely overbought, so the pullback higher of the larger downtrend which started last week was complete yesterday.
That chart pattern pointed to a bearish reversal and it is even stronger today after the big bearish candlestick. Now this pair has turned bearish and it is heading towards 1.30 again. The FED might change the course for the USD later in the evening, but the technicals point down at the moment. Actually, the FED might even take us down to 1.30 and even lower pretty fast if they sound increasingly dovish today.
- Check out our free forex signals
- Follow the top economic events on FX Leaders economic calendar
- Trade better, discover more Forex Trading Strategies
- Open a FREE Trading Account