USD/CAD Bounces Higher Off the 50 SMA
USD/CAD slipped lower yesterday and we decided to buy it. Today it bounced off the 50 SMA and we booked profit
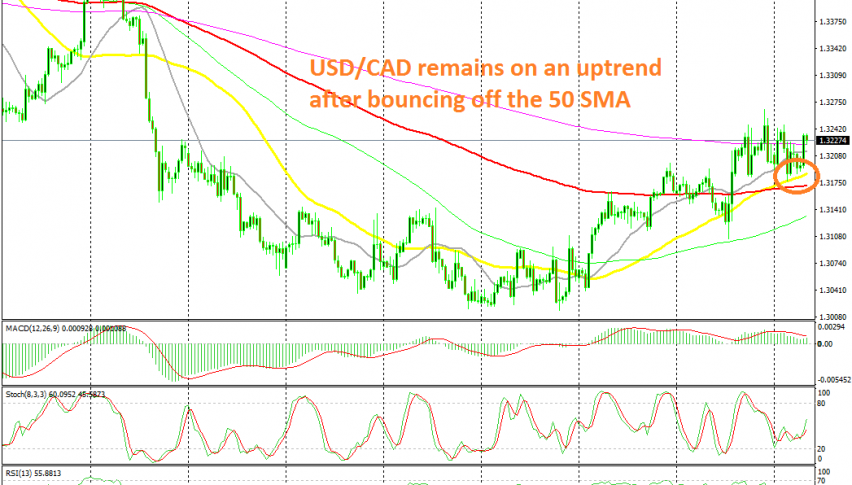
[[USD/CAD]] had a terrible month in June as the CAD surged, following the climb in crude Oil prices. Last month, this pair consolidated in a range above the 1.30 level which formed a support zone but in the last two weeks, USD/CAD turned bullish.
We saw a 200 pip climb as the USD turned bullish again on expectations that the FED wasn’t going to keep cutting interest rates after the rate cut planned for last week, which they didn’t. USD/CAD pushed above the 200 SMA on the H4 chart at the end of last week, but yesterday we saw a decent pullback lower.
We decided to go long on this pair at the 20 SMA (grey) since this moving average provided support late on Friday. But, the decline stretched further below and the price reached the 50 SMA (yellow) which did provide solid support twice. The price formed a small doji candlestick which is a reversing signal after the pullback and now we are back above the 200 SMA (purple) again. So, the 50 SMA has turned into support now and it seems like a good place to buy this pair.
- Check out our free forex signals
- Follow the top economic events on FX Leaders economic calendar
- Trade better, discover more Forex Trading Strategies
- Open a FREE Trading Account


