The 50 Weekly SMA Holds the Decline in Dax for Now
Stock markets have turned pretty bearish again after new tariffs on China, but the 50 SMA is holding on for Dax at the moment
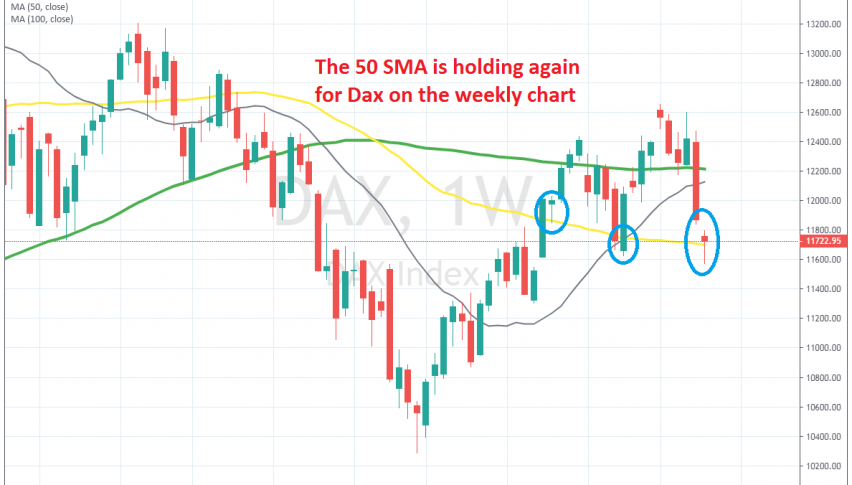
Stock markets have been pretty bullish this year. Although, we saw a decent pullback in June as tensions in trade negotiations between US and China increased again. The uptrend resumed again in July after DAX found some support around the 50 SMA (yellow) on the weekly chart and we saw this index make new highs last month.
Last week though, the sellers returned again and Dax made a big bearish candlestick, as you can see from the weekly chart above. The announcement of new tariffs on China from Donald Trump last Thursday hurt the sentiment in financial markets and stock markets turned bearish.
This week stock markets opened with a bearish gap and stretched the decline further to the downside. But Dax is now trading around the 50 SMA once again which is providing support. The price slipped below the 50 SMA earlier this week, but it has retrace back up above it.
Now, the weekly candlestick looks like a hammer which is a reversing signal after the decline, but we’re still in the middle of the week, so the candlestick is not complete yet.
Sellers might have some tough time at the 50 SMA, but with the global economy weakening and the escalating trade war, I think that the 50 SMA will be broken this time. The break would open the door for further declines and it would be a good moment to go short on stock markets.
- Check out our free forex signals
- Follow the top economic events on FX Leaders economic calendar
- Trade better, discover more Forex Trading Strategies
- Open a FREE Trading Account
- Read our latest reviews on: Avatrade, Exness, HFM and XM
Related Articles


Sidebar rates
Related Posts
