Three Signs Showing Sellers are in Control in Crude Oil
Crude Oil has turned bearish again and now the downside is picking up pace. All signs point to further declines
Crude Oil was pretty bullish in Q1 of this year after having a terrible time in Q4 of 2018. But, in Q2 the situation reversed for Oil and the trend bearish. US WTI crude made a bearish reversal towards the end of April after China backtracked on promises to the US and by the middle of June, the price fell close to $50.
In June the situation improved for Oil as the sentiment improved in financial markets and WTI climbed to $61, also helped by the extension of production quotas from OPEC+. But, the buyers couldn’t hold on to gains and eventually the bearish momentum returned. Last week, Donald trump tweeted about more tariffs on China and now Oil is heading for the $50 level again, which it might even break this time. So, Crude Oil is now bearish and from the H4 chart above we can spot three signs which show that Crude Oil is and will remain bearish for some time.
1. Lower Highs
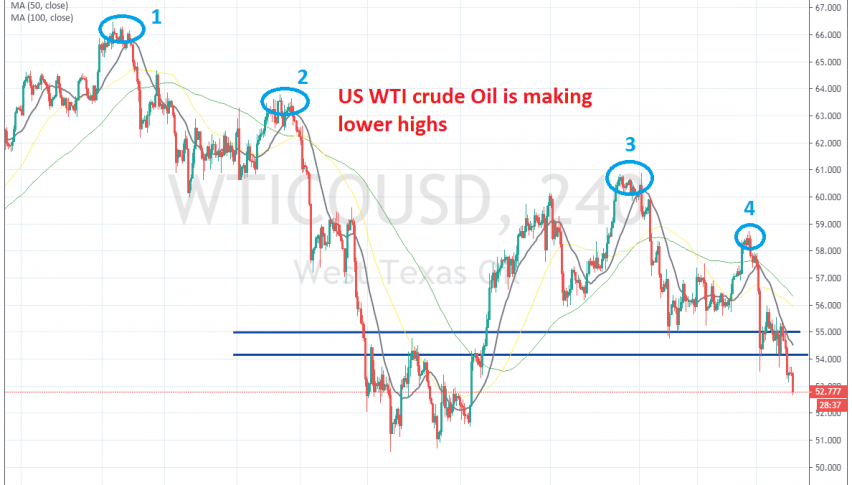
As you can see from the H4 chart above, US WTI crude has been making lower highs since late April. First at $66.50s, then at $64, $61 and finally last week at $59. The lows have also been getting lower, apart from the big decline which took us to $50 in June. But if highs are getting lower, the $50 level will also be broken soon.
2. The Break of Support
The area from $54 to $55 turned into resistance during June as the price was bouncing between this zone and the $50 level. This area turned into support during the second half of July but it was finally broken yesterday. Now this area should turn into resistance again.
3. The 20 SMA Turns Into Resistance
This week we saw the latest pullback for Crude Oil. But, sellers didn’t wait too long and they started pushing lower once the 20 SMA caught up with the price. When the smaller period moving averages push the price down, it shows that the trend and the pressure is strong. So, down goes WTI which has lost $1 today and now we head for the $50 level again.
- Check out our free forex signals
- Follow the top economic events on FX Leaders economic calendar
- Trade better, discover more Forex Trading Strategies
- Open a FREE Trading Account


