Crude Oil’s Doji Pattern In Spotlight – Is It Going to Reverse Lower?
China’s crude oil imports in July raised 14% from the previous year while exports of refined fuel climbed 20% as recovering profit margins..
On Thursday, the black crack crude oil is has started trading lower after testing 52.75 resistance level. China’s crude oil imports in July raised 14% from the previous year while exports of refined fuel climbed 20% as recovering profit margins prompted refiners to ramp up output that at the same time added to a growing fuel glut.
According to data released by the General Administration of Customs, crude oil imports last month were 41.04 million tonnes, equivalent to 9.66 million barrels per day on Thursday. Compared to 9.63 million bpd in June, it marked the highest processing rate in three months.
Thus, the recent jump of $1 a barrel in crude oil was perhaps due to expectations that falling prices may lead to production cuts by OPEC members.
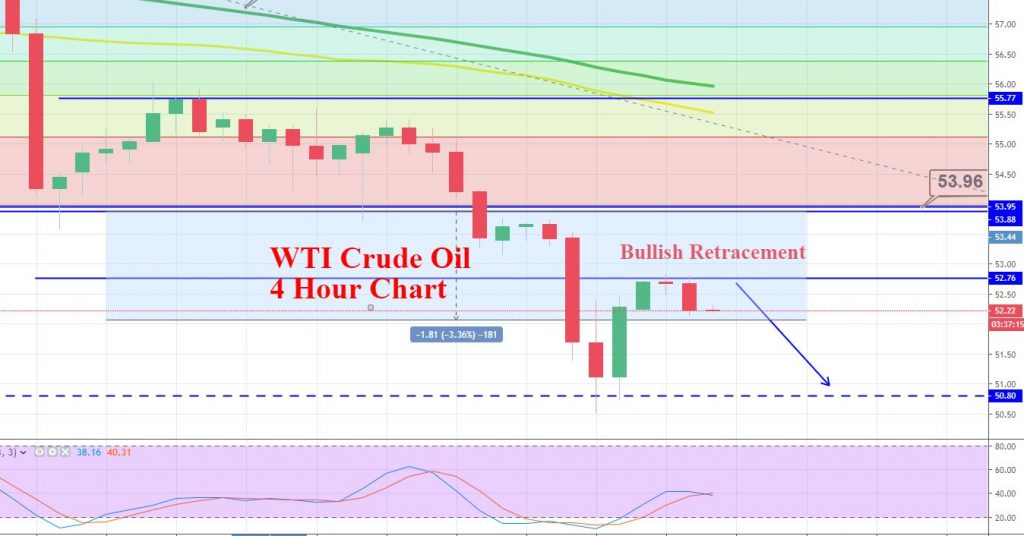
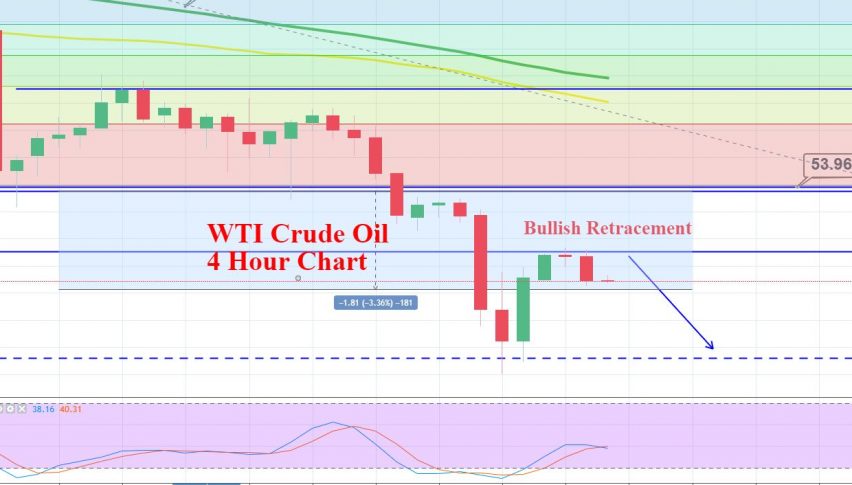
Crude Oil – Technical Analysis
Crude oil has violated a long-held sideways range of 55.70 – 54. On the lower side, oil has an open room to go after 52.15.
The 50 and 100 periods of EMA are pushing oil prices lower, suggesting a bearish trend. While the RSI value stays around 14, which is extremely oversold. But commodities tend to stay in the oversold zone for longer periods before taking reversals.
I’m looking to stay bearish below 52.30 with a stop loss above 52.60 and take profit of around 51.65.
Good luck!
- Check out our free forex signals
- Follow the top economic events on FX Leaders economic calendar
- Trade better, discover more Forex Trading Strategies
- Open a FREE Trading Account
- Read our latest reviews on: Avatrade, Exness, HFM and XM
Related Articles
Sidebar rates
Related Posts
