AUD/USD is Failing at the 50 SMA
AUD/USD has been on a strong downtrend, but it has retraced higher in the last fee days which now seems complete
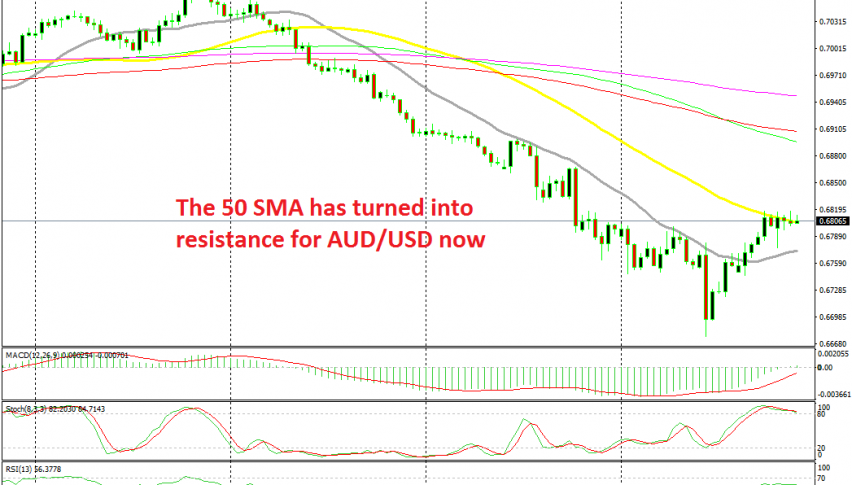
[[AUD/USD]] has been on a bearish trend for three weeks since it reversed below the 0.71 level. Since then, this pair has lost more than 300 pips from top to bottom and the the 20 SMA (grey) has been pushing the price lower, as it has been providing resistance three times.
On Wednesday, we saw the last push lower after the Reserve Bank of New Zealand cut interest rates by 50 bps to 1.00% from 1.50% which sent the Kiwi lower and pulled AUD/USD down with it. This pair fell to 0.6670s, but retraced up that day and it formed a doji candlestick on the daily chart, which is a reversing signal after the three week decline.
The price retraced higher in the following days and this time the buyers pushed above the 20 SMA on the H4 chart. We decided to sell the retrace and went short at the 20 SMA, hoping that the retrace higher would be over at the 20 SMA again, especially after the price formed an upside-down hammer candlestick which is another reversing signal, this time to the downside.
But, the pullback continued higher and buyers pushed this pair to the 50 SMA (yellow) on the H4 chart. Although, they haven’t been able to push above this moving average since yesterday in the US session. The price has been stuck at the 50 SMA which has been providing resistance. Now the price has formed a few doji and hammer candlesticks which point down and the price is overbought on this time-frame, so a reversal down should come soon. We are holding on to our signal.
- Check out our free forex signals
- Follow the top economic events on FX Leaders economic calendar
- Trade better, discover more Forex Trading Strategies
- Open a FREE Trading Account


