


The market is in quite an indecisive state and with its sideways movement for the last couple of weeks, it seems to be only a matter of time until heavy movements in either direction occur. To understand what the chances of Bitcoin breaking out bullishly or bearish are, we look at the technical indicators to see where Bitcoin and the correlating cryptocurrency market is heading to.
BTC/USD WEEKLY CHART
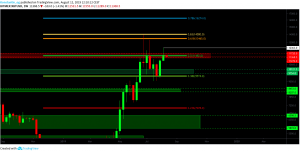
Bitcoin reached all the way up to $12,300 where it quickly started to decline heavily afterwards. The weekly candle closed slightly above $11,500. Nevertheless, Bitcoin was rejected by the $11,500 resistance which resulted in a decent downward move. For now, it seems likely that Bitcoin is moving between the support between $9,500 and the $10,000 mark and the resistance at $11,500. A break of one of these key levels would indicate further movement in either direction.
BTC/USD DAILY CHART
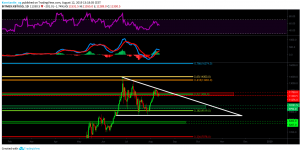
Bitcoin is currently forming a bearish descending triangle pattern in the daily chart. The upper trendline acts as significant resistance and needs to be broken in order to deny the bearish pattern. It seems likely that Bitcoin is continuing its retracement down to the major support between $9,500 and $10,000. If Bitcoin goes for another rally towards the upside, it needs to break the $11,500 mark in order go for a re-test of the $14,500 range. The MACD gives no clear signal, however the MACD lines didn’t cross bearishly yet while the histogram is ticking lower.
ETH/USD DAILY CHART
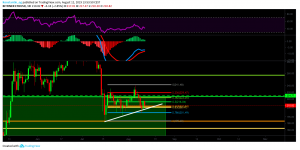
Ethereum is performing a series of higher lows, however, it declined sharply after reaching up to the $240 mark. While it found short-term support at the 0.786 fib level, it was harshly rejected by the 0.382 fib level. With it now being at the golden pocket and the trend line support, it seems likely that Ethereum finds short-term support again and goes for a re-test of the 0.382 fib resistance at $222. Furthermore, the MACD lines are very close to a bearish crossover and the histogram is ticking lower. Both indicate bearishness, however, the MACD remains neutral for now as the MACD lines are still bullish.
XRP/USD DAILY CHART
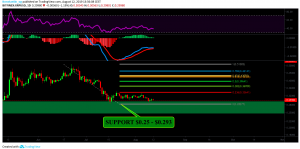
XRP was rejected by the 0.236 fib level multiple times and is heading down to the support zone between $0.25 and $0.29. For now, XRP will most likely continue to decline. Additionally, the MACD is about to cross bearishly and the histogram is ticking lower while the RSI is nearing oversold regions. XRP should bounce towards the upside in the next couple of weeks. However, for now it seems likely that XRP is going for a lower low.
The biggest gainers of the week were
MATIC, which surged by more than 70 percent,
DXG, which gained by 262 percent, and
COS, which rose by more than 33 percent.