Getting Ready to Buy the Pullback in EUR/GBP
EUR/GBP has retraced lower this week but the trend is still bullish and the retrace is almost complete, so I am thinking of buying this pair

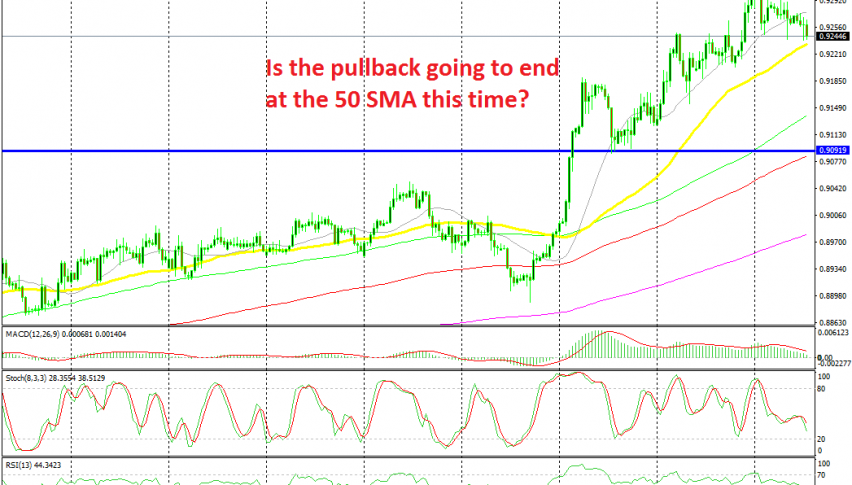
EUR/GBP has been on a bullish trend since the end of May when it turned higher just below the 0.85 level. The uptrend was quite straightforward, with the 50 SMA (yellow) and the 100 SMA (green) providing support during pullbacks on the H4 chart.
In the third week of July we saw a decent pullback lower in this pair, but the 50 SMA held the decline on the daily chart and reversed the price higher. In the following week the uptrend resumed and it picked more speed after the election of Boris Johnson as the new Prime Minister of Briatin. He didn’t offer anything new regarding Brexit and the GBP crashed lower, sending this pair higher in the following weeks.
The price reached 0.9320 last week, but this week we have ben seeing a retrace lower in EUR/GBP. This pair is now edging closer to the 50 SMA where we plan to go long from since it has been a decent support indicator during this three-month uptrend. The previous H4 candlestick closed as a doji which is a bullish reversing signal after the decline while stochastic is almost oversold, which makes the retrace down almost complete. So, we’re following the price action to look for other reversing signs before buying.
Update: We went long above the 50 SMA and the decline has stalled now at this moving average.
- Check out our free forex signals
- Follow the top economic events on FX Leaders economic calendar
- Trade better, discover more Forex Trading Strategies
- Open a FREE Trading Account


