MAs Turn From Resistance Into Support of USD/CAD
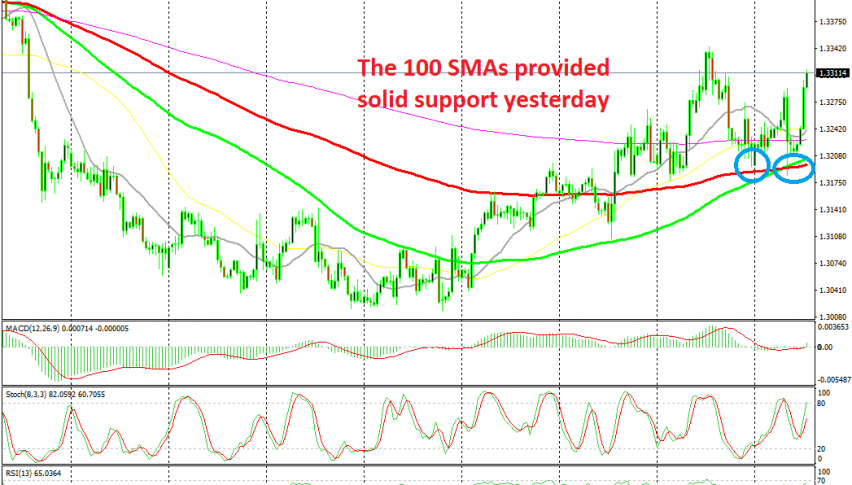
USD/CAD has tried to break below the 100 SMA twice this week, but it couldn't and it reversed higher both times

[[USD/CAD]] made a bearish reversal and entered a strong bearish trend in June as Oil prices climbed higher, which helped the CAD as a commodity currency closely correlated to crude Oil. the price consolidated for a couple of week above 1.30 in July, so a support zone formed down there.
The price started reversing higher toward the end of July as the climb in crude Oil stopped. USD/CAD was finding resistance at moving averages at it was climbing higher, particularly the 100 simple MA (green) and the 100 smooth MA (red) on the H4 chart.
The price climbed to 1.3340s at the middle of last week, but the 100 SMA on the daily chart provided resistance and reversed this pair lower. Since then, the price has retraced lower but the 100 SMA (red) turned from resistance into support at the beginning of this week.
Yesterday, we saw another attempt at breaking this support indicator, but the 100 smooth MA resisted once again, this time helped by the 100 simple MA. Now these moving averages have turned into good support indicators to go long on USD/CAD when the price retraces lower again.
- Check out our free forex signals
- Follow the top economic events on FX Leaders economic calendar
- Trade better, discover more Forex Trading Strategies
- Open a FREE Trading Account


