Bitcoin Forms A Bullish Reversing Pattern Above $9.000 Again
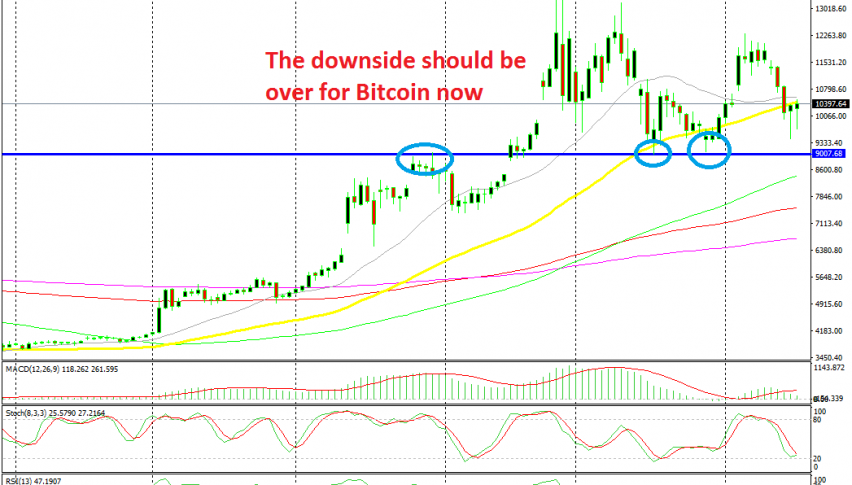
Bitcoin has failed to push below support at $9,000 once again and is now forming a reversing pattern
We know that cryptocurrencies are really trendy. In 2017 we saw a gold rush for altcoins and BITCOIN surged to $20,000 almost, in just a few months. But, in December that year the gold rush came to an end and we saw Bitcoin reversed back down and broke all levels after finding support at them for some time. The decline stopped at the end of last year above $3,000 and Bitcoin traded between that level at the bottom and $4,000 at the top. This range bound trading lasted throughout the Q1 of this year.
In Q2, things changed though. The $4,000 level was broken and buyers gained confidence, while sellers dumped all their trades which helped send Bitcoin higher. Buyers found some resistance at $5,000 which turned into a resistance level for several weeks, helped by the 50 SMA (yellow) as well on the weekly chart. But, that level and the 50 SMA were also broken in April, which was the final sign that the trend had shifted to the upside.
Since then, the pressure has totally been on the upside for Bitcoin and other major cryptocurrencies. The $9,000 level provided resistance once at the end of May, but it was broken without much resistance in June and the big round level at $10,000 was overwhelmed as well. I thought that the big round level would hold for some time, but it was broken quite easily and the high on my platform came at $13,850.
In the last two months, Bitcoin has traded sideways mostly and now it has formed a bottom at $9,000. That resistance level turned into support last month. We saw Bitcoin bounce twice from that level in July. The price bounced higher this month, but it has reversed back down this week.
Although, it seems like the support zone surrounding the $9,000 level is holding on again this month. On Thursday, the price declined to $9,450, but the price pulled back higher and closed the day above $10,000. Today, sellers had another attempt at pushing down, but the price reversed higher at $9.700, which is a sign that the sellers are loosing steam.
The two hammer candlesticks are another strong sign that a bullish reversal will come soon. Stochastic has just become oversold, which means that the bearish move is complete, so we got a number of signs signalling us that a bullish reversal is coming soon. This might be a good time to go long on Bitcoin.
- Check out our free forex signals
- Follow the top economic events on FX Leaders economic calendar
- Trade better, discover more Forex Trading Strategies
- Open a FREE Trading Account