Selling NZD/USD at the 20 SMA Proved to Be A Good Decision


This morning the commodity Dollars tumbled lower after the disappointing figures from the construction work done is Australia for Q2. Construction work has been declining in the last four quarters, painting a bleak picture for the Australia economy. The economy of New Zealand is correlated to Australia, so the Kiwi took a dive after that report together with AUD/USD.
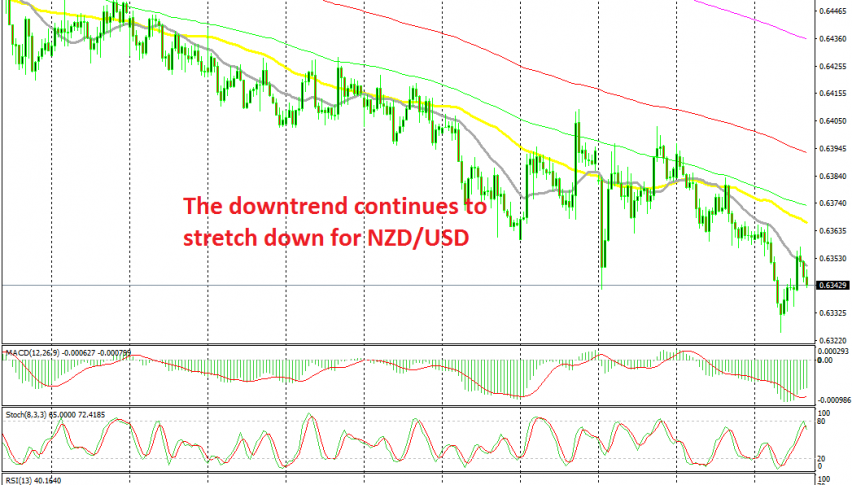
Although the decline stopped for NZD/USD in the European session and the price started retracing higher in the following hours. But, the retrace ended at the 20 SMA (grey) on the H1 chart. That was a sign that the downtrend was picking up pace again after the range trading in recent days.
Another sign that the retrace higher was coming to an end was the small upside down hammer candlestick. That’s a reversing signal. Besides that, the stochastic indicator was overbought, so all signs were pointing to a bearish reversal and the reversal came pretty quick. Now our signal in this pair is around 20 pips in profit and approaching the take profit target.