Gold Violates Symmetric Triangle Pattern – 50% Fibo in Focus
During the late Asian session, the prices of the yellow metal slipped as the United States and China hinted that trade discussions between..
During the late Asian session, the prices of the yellow metal slipped as the United States and China hinted that trade discussions between both sides could start again. However, the trade war is still on, but investors seem to do profit-taking on overbought gold ahead of the weekend.
The precious metal gold, which stays supported over the boosted safe-haven appeal, has started dropping now. China’s representative Gao Feng said that China will not retaliate against the United States President Donald Trump’s latest tariff move.
Besides, Gao Feng also told that China would like to settle and negotiate with the United States to resolve this trade war concern with a relaxed attitude; however, the United States needs to cancel a tariff hike.
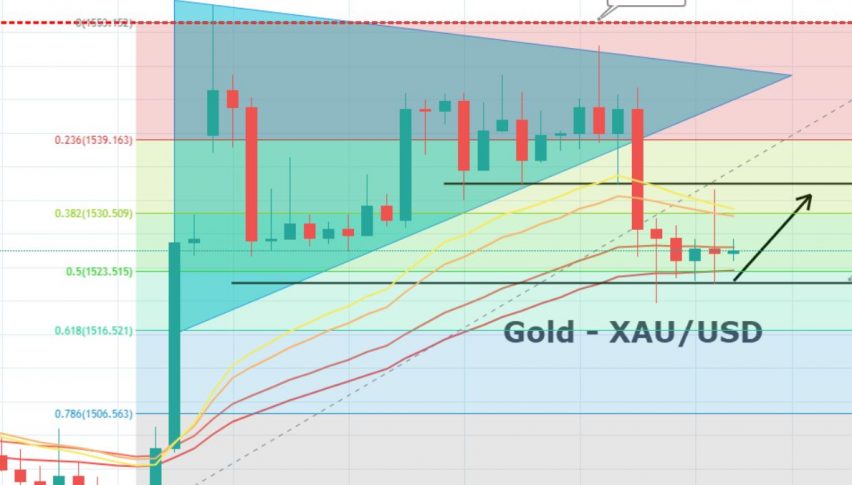
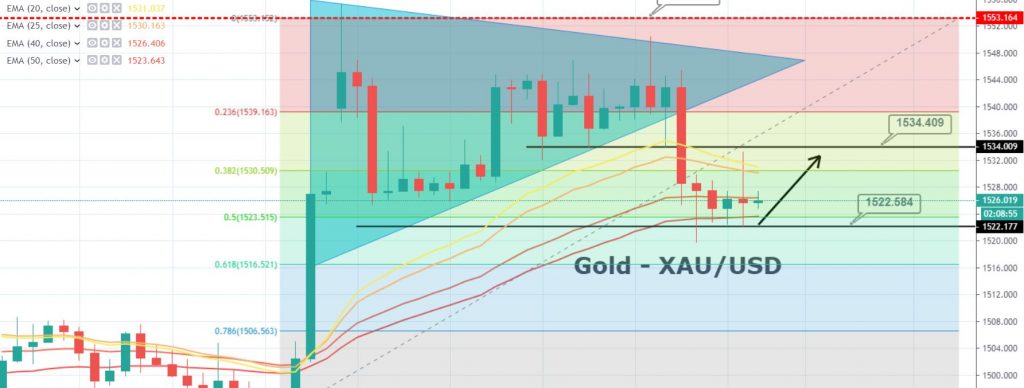
GOLD – XAU/USD – Technical Outlook
Gold seems bullish above 1,537 as it’s been holding above this level since US session. Whereas, the 14 periods EMA is signaling a bullish trend while supporting gold around 1,537. Immediate resistance is at 1,544 and closing above this level is likely to bring more buyers until 1,554. So, we are staying bullish above 15,43 today and so far the market is in our favor. For now, gold is heading towards 50% Fibonacci support area of 1,521.
Daily Support and Resistance
S3 1471
S2 1501.82
S1 1514.81
Pivot Point 1532.64
R1 1545.63
R2 1563.46
R3 1594.28
Gold – XAU/USD – Trade Plan
We may see a bearish trend in gold below 1527 until 1521. Below this, gold can go after 1515. Major resistance will be 1527 and 1532.64.
Good luck!
- Check out our free forex signals
- Follow the top economic events on FX Leaders economic calendar
- Trade better, discover more Forex Trading Strategies
- Open a FREE Trading Account