Is the 100 SMA Going to Keep the Uptrend Going for USD/CAD Again?
USD/CAD tumbled on a less dovish statement from the BOC, but the 100 SMA is still holding on the H4 chart
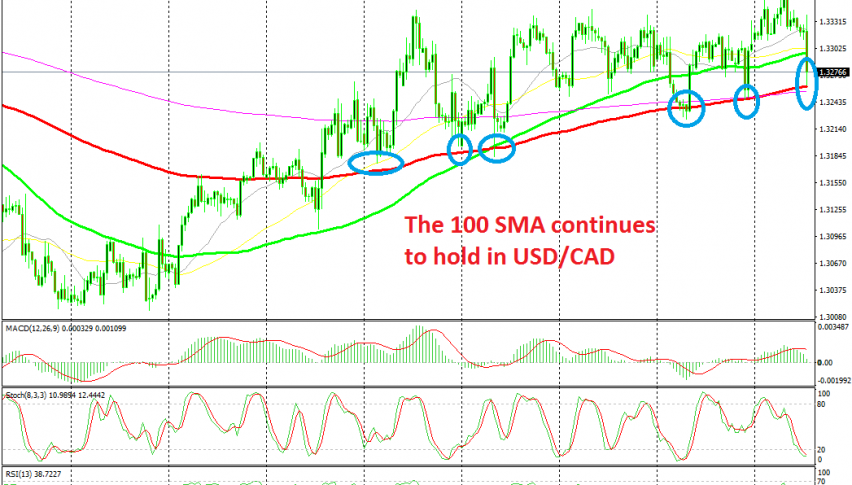
[[USD/CAD]] has been on a bullish trend since the middle of July when it reversed higher at 1.30 which is a big support level for now. During the first several weeks, the trend was strong and this pair broke above all moving averages on the H4 time-frame chart, as you can see above.
In August the trend slowed down though. You might argue that since the beginning of August this pair has traded in a range, but highs have been getting higher and so have the lows, which means that this is still a bullish trend, although much slower than in July.
Speaking of the lows, they have ended at the 100 SMA (red) several times during the pullbacks lower. Last week we saw USD/CAD pullback lower to the 100 SMA twice, but the pullbacks ended right at this moving average. So, this indicator has been the one to define the trend. Today we saw another decline to the 100 SMA after the statement from the Bank of Canada which was less dovish than markets wee anticipating.
But, the 100 SMA held again on the first attempt today. The stochastic indicator is oversold already which means that the pullback lower is complete, but the USD weakness continues today as well after the soft ISM manufacturing report yesterday, so the pressure remains on the downside. We will see if the 100 SMA holds. If it does, we might go long from here.
- Check out our free forex signals
- Follow the top economic events on FX Leaders economic calendar
- Trade better, discover more Forex Trading Strategies
- Open a FREE Trading Account


