Has the Climb Stopped at the 100 SMA for EUR/USD?
EUR/USD has been bullish this week on the back of USD weakness, but the climb might have ended at the 20 SMA on H4 chart
[[EUR/USD]] has been bearish for a long time and it turned even more bearish at the end of last week and the beginning of this one. This pair finally broke below the big round level at 1.10 last week and it fell to 1.0920s as fundamentals continued to deteriorate in the Eurozone.
But, the sentiment turned positive as the week progressed and this pair made a swift reversal, especially since Tuesday after the US ISM manufacturing report showed that this sector fell in contraction in August. The USD turned bearish and EUR/USD climbed around 150 pips in total.
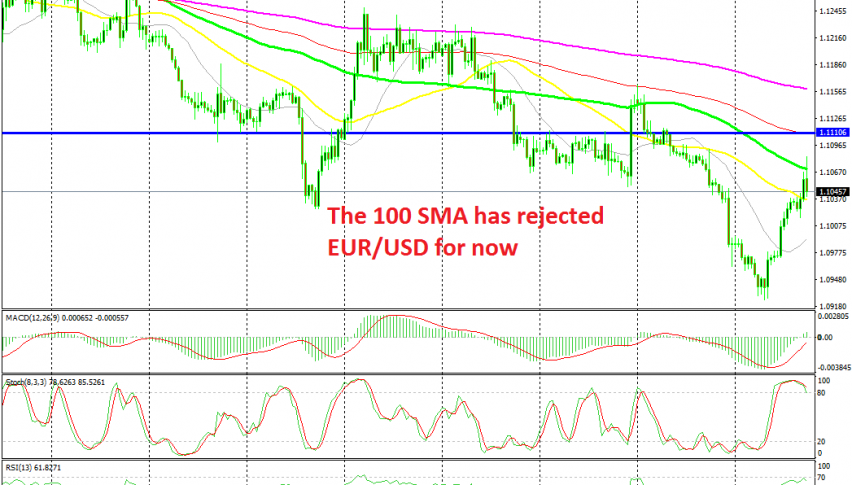
The price broke above the 50 SMA (yellow) on the H4 chart this morning and it even pierced the 100 SMA (green). But, it retraced back down and the H4 candlestick closed below it, so that doesn’t count as a break. The stochastic indicator is severely overbought and it is turning down now, so perhaps this is it for the bullish momentum of this week. Although, the 50 SMA is acting as support right now, so if the larger bearish trend is to resume, the 50 SMA should go soon.
- Check out our free forex signals
- Follow the top economic events on FX Leaders economic calendar
- Trade better, discover more Forex Trading Strategies
- Open a FREE Trading Account


