Crude Oil Turns Bullish Again and Faces the 100 Daily SMA
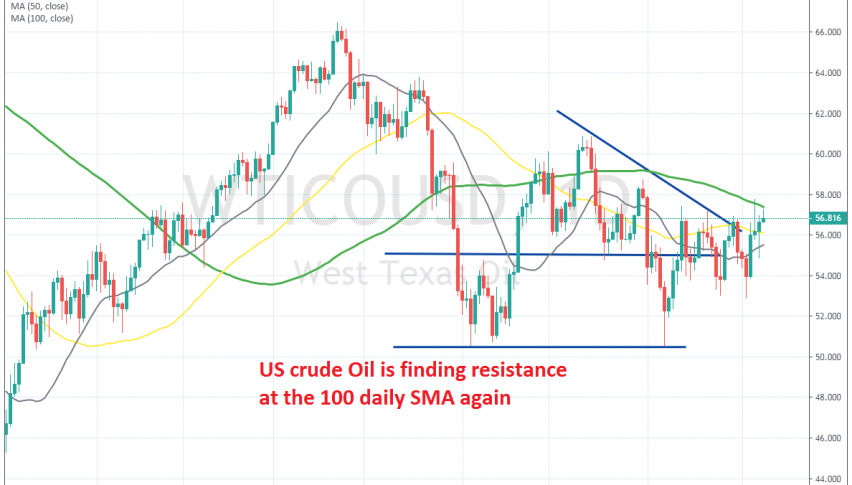
US WTI Crude Oil turned bullish at the middle of last week and climbed around $5 in a few days, reaching $58. But, the buyers gave up right at the 100 SMA (green) on the daily chart. This moving average provided support on the way down in May and it seems like it has turned into resistance now.
The 100 SMA rejected the price on Thursday and that day’s candlestick formed an upside-down hammer candlestick which is a reversing signal. The price started to reverse down on Friday, but it stopped declining below $55 and since then the price has been climbing higher as the sentiment keeps improving in financial markets.
Today seems like another bullish day so far, with the price right now at $56.80. US crude Oil climbed above $57 earlier this morning, but it has pulled back down. So, it seems like the 100 SMA is acting as resistance again. This looks like a good chance to go short on US Oil and we might do so, but we will wait for a reversal confirmation, such as a doji candlestick on the H1 or H4 charts.


