EUR/USD Forms A Reversing Pattern at MAs
EUR/USD has been bullish for about a week, but moving averages are preventing it from moving higher

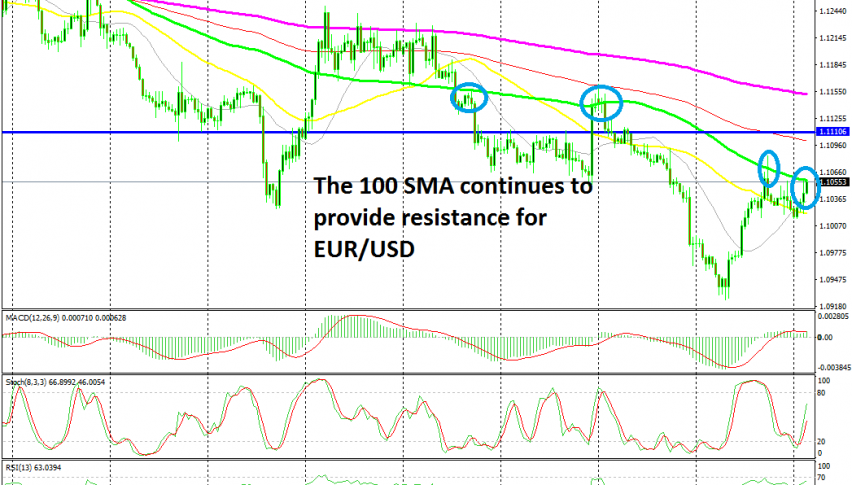
[[EUR/USD]] turned pretty bullish at the beginning of last week as the US turned soft and the sentiment improved in financial markets. This pair came back from the dead below 1.10, although the buyers weren’t able to break above the 100 SMA (green) on the H4 time-frame chart.

The 200 SMA is keeping EUR/USD in check today
That moving average provided resistance last week and it is doing the same job today, as the price keeps knocking on it. If we switch to the H1 chart, we se that it is the 200 SMA (purple) which has been providing resistance. This moving average was pierced last Thursday, but the price returned back below it.
Today EUR/USD is finding resistance at the 200 SMA again. The price pierced it earlier, but it has retraced back below it and formed a doji candlestick right below the 200 SMA. This is a reversing signal and stochastic is overbought on this time-frame, so we decided to go short earlier on. Now let’s see if the reversal will happen.
- Check out our free forex signals
- Follow the top economic events on FX Leaders economic calendar
- Trade better, discover more Forex Trading Strategies
- Open a FREE Trading Account


