Daily Brief, Sep 11: Economic Events Outlook – Brace to Trade EIA Report
The market is trading sideways due to the lack of top-tier economic events. In fact, the U.S. dollar remained steady but stronger against...
On Wednesday, the market is trading sideways due to lack of top-tier economic events. In fact, the US dollar remained steady but stronger against the euro as investors await the European Central Bank minimum bid rate on Thursday. ECB is expected to cut interest rates further into negative territory and perhaps restart asset purchases.
Traders are considering whether the additional monetary stimulus will be useful in countering economic instability in the euro region and whether the ECB will deceive dovish sentiments which have already been priced in the market.
Watchlist – Economic Events Outlook
USD – PPI m/m – 12:30 GMT
The producer’s price index is considered a leading indicator of consumer inflation. When producers charge extra for goods and services, the higher costs are usually passed on to the consumer. So, higher PPI can lead to higher CPI, which pressures central banks to release hawkish monetary policies.
The current PPI figure is anticipated to grow by 0.0% in September, which is way less than the rate of July 0.2%.
USD – Core PPI m/m – 12:30 GMT
It also shows a change in the price of finished goods and services sold by producers, excluding food and energy. The figure is anticipated to grow by 0.2% m/m in September, which is way higher than the rate of July at -0.1%.
EIA Crude Oil Inventories – 14:30 GMT
On Tuesday, the American Petroleum Institute announced that US crude stocks declined by 7.2 million barrels for the week concluding on September 6. The API figures also reportedly revealed a stockpile drop of 4.5 million barrels in gasoline, while distillate stocks increased by 618,000 barrels. Inventory figures from the Energy Information Administration (EIA) will be released later today on Wednesday.
The EIA numbers are anticipated to dispense crude inventories declining by 3.6 million barrels last week, according to a poll of economists surveyed by S&P Global. Whereas, the Gasoline stocks are projected to decrease by 1.4 million barrels.
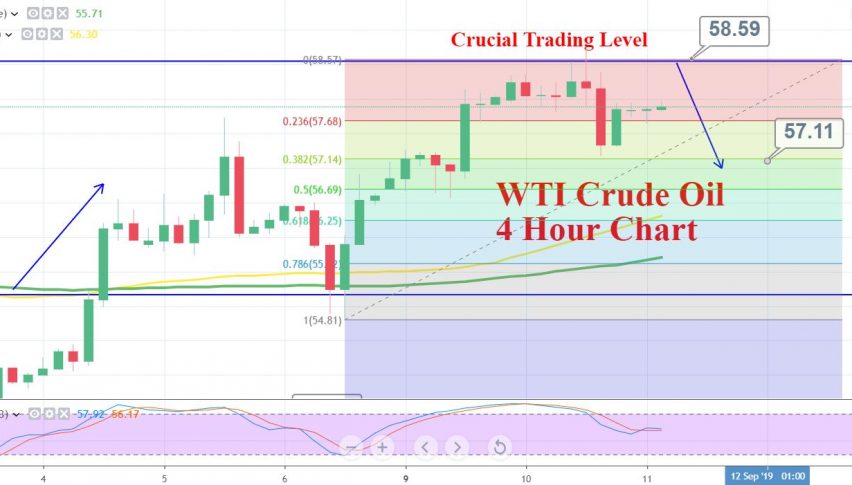
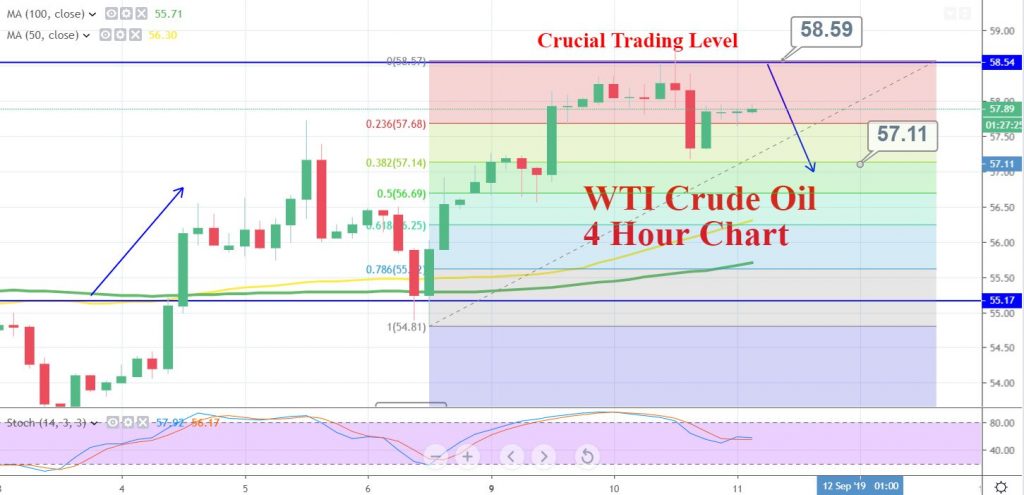
WTI Crude Oil – Technical Outlook
WTI crude oil has traded mostly in line with our forecast as it continues to trade lower below 57.99, the swing trade entry-level. So far, the technical side hasn’t changed a lot as investors await the EIA report later today.
Crude oil has formed a series of Doji candles followed by a tweezers top pattern. Both these patterns are bearish in nature and typically drive a bearish reversal. The relative strength index (RSI) is holding in the overbought zone, looking for a reason to enter into the selling zone.
The Fibonacci retracement indicator is suggesting support around 23.6% Fibo levels at 57.50 and 38.2% level at 56.99.
WTI Crude Oil – Technical Levels
Support Resistance
56.97 58.51
55.98 59.07
54.43 60.61
Key Trading Level: 57.52
WTI Crude Oil – Trade Plan
I’m still sticking with the swing trading signal to stay in sell position below 57.99 with a stop loss above 59.39 and take profit of around 57.19.
Good luck!
- Check out our free forex signals
- Follow the top economic events on FX Leaders economic calendar
- Trade better, discover more Forex Trading Strategies
- Open a FREE Trading Account


