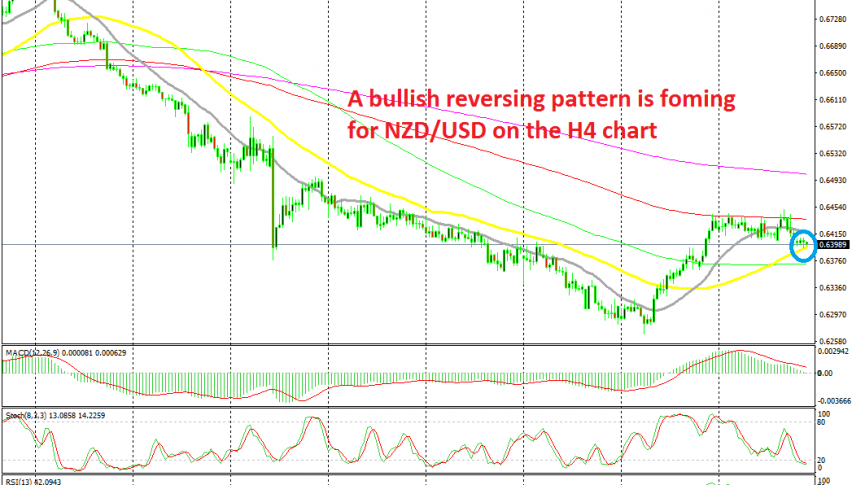
Is the 50 SMA Going to Turn Into Support as we go Long on NZD/USD?


[[NZD/USD]] turned quite bullish last week as risk sentiment improved, sending safe havens lower and risk assets such as commodity currencies higher. As a result, NZD/USD climbed around 170 pips, from 0.6260s to 0.6440s during last week.
But, NZD/USD buyers ran into the 100 smooth moving average (red) on the H4 chart, which has been providing resistance throughout this week. Buyers have tried to break that moving average several times since the first attempt last Friday, but they have failed and today they seem to have given up after the last failure yesterday. The price pierced the 100 SMA but it pulled back lower to close the candlestick below it again and form an upside-down pin, which is a reversing signal.
The price has reversed down and has retraced lower today, but it seems like the pullback might be over now. The stochastic indicator is oversold on this time-frame, which means that the retrace lower is complete. The 50 SMA (yellow) which has acted as resistance on the way down seems to be providing support right now, while the last few candlesticks have formed some pins and dojis, which are reversing signals. We decided to go long on this bullish reversing chart patterns, so we’re long again on this pair.