AUD/USD Reverses Down After the Bearish Reversing Chart Pattern
AUD/USD turend pretty bullish at the start of this month, but the price reversed down after forming a bearish reversing pattern
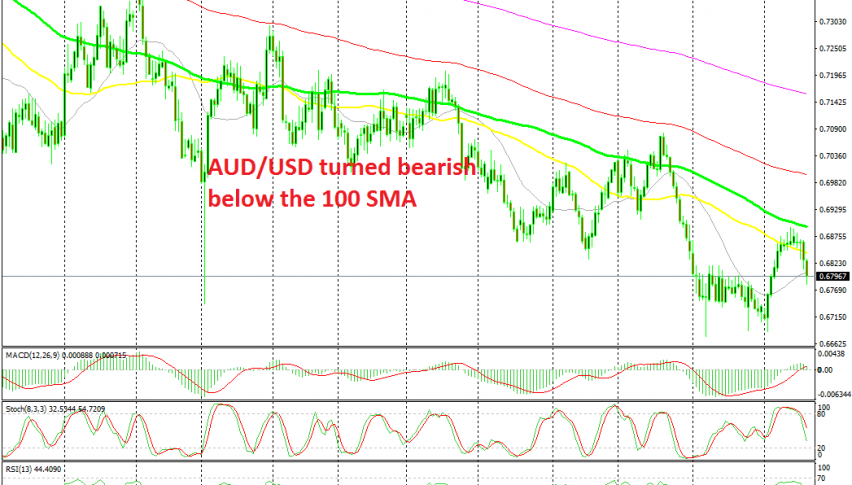
[[AUD/USD]] has been on a long term downtrend, but it made quite a strong bullish move in the first half of this month. The area around 0.6680-90 held for the third time, which confirmed it as a strong support area and this pair turned bullish, climbing more than 100 pips higher. The USD weakness during that period helped as well.
But, buyers couldn’t push above the 0.90 level and the 100 SMA (green) on the daily chart. Last week, the price formed a few doji and upside-down hammer candlesticks, which are bearish reversing signals after the retrace higher. That was a sign that the buyers were running out of steam.
The stochastic indicator was also severely overbought on this time-frame, so the chart patter for a bearish reversing pattern was complete. We could have gone short from there based on technicals alone, but the upcoming FED meeting made the situation uncertain.
The bearish reversal started to take form this week and yesterday this pair made the second big bearish candle in two days, after the soft employment figures and the tick higher in unemployment rate in Australia. So, this is the picture for this pair now. It is in a long term bearish trend and pullbacks higher should be seen as good opportunities to go short.
- Check out our free forex signals
- Follow the top economic events on FX Leaders economic calendar
- Trade better, discover more Forex Trading Strategies
- Open a FREE Trading Account
- Read our latest reviews on: Avatrade, Exness, HFM and XM
Related Articles


Sidebar rates
Related Posts
