Litecoin Turns Bearish as MAs Turn From Support to Resistance
Litecoin turned bullish this month, but a number of moving averages decided to reverse it lower again

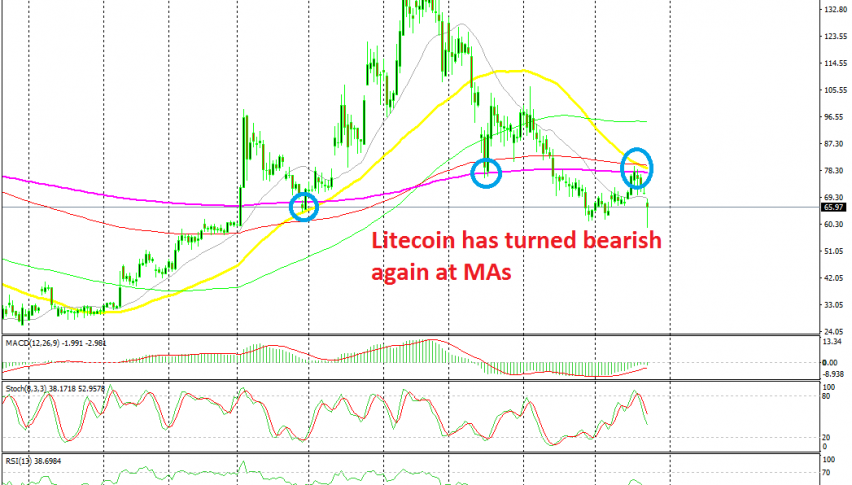
Cryptocurrencies turned pretty bullish in Q2 of this year and in June. LITECOIN was trading at around $25 in Q1, but by the middle of June, this altcoin was trading at $145. That means a 600% gain in value in just a few months. The same scenario took place in most major cryptos, although Litecoin was one of the best performers.
Although, Litecoin gave back half of those gains in the following months. BITCOIN has been trading sideways mostly in the last couple of months, while Litecoin has retraced lower. Although, buyers have returned again this month and Litecoin has made some gains in September.
But, the buyers ran into a bunch of moving averages last week. These moving averages used to be support when Litecoin was climbing, particularly the 50 SMA (yellow) and the 100 SMA (red). Now, they have turned into resistance.
I highlighted these moving averages last week and now the scenario I predicted has come in play. Litecoin has reversed lower in the last several days. The daily chart points to further declines as stochastic is heading down and still has some more room to run.
- Check out our free forex signals
- Follow the top economic events on FX Leaders economic calendar
- Trade better, discover more Forex Trading Strategies
- Open a FREE Trading Account


