MAs Continue to Support USD/CAD
USD/CAD has retraced lower in the last few sessions, but MAs keep doing their job as support, just like last week
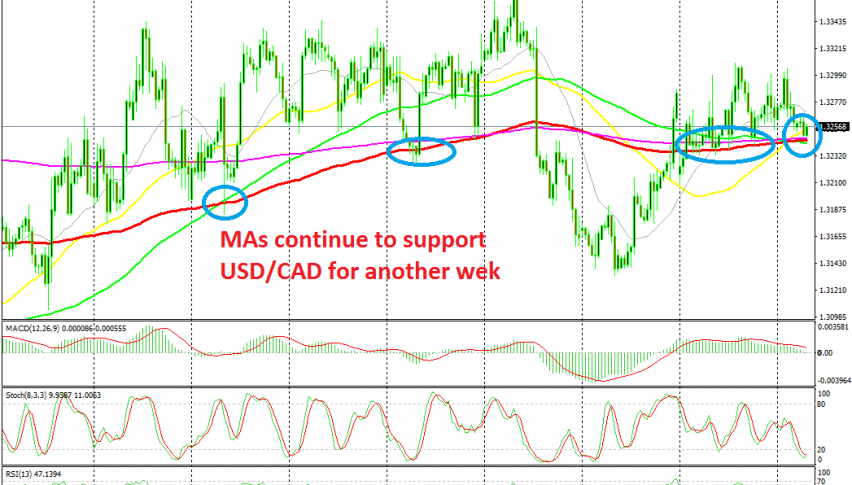
Yesterday we decided to go long on USD/CAD on the European session as this pair was retracing lower, after the small jump in the Asian session. We were trading the H1 chart on this pair, although the H4 time-frame has a bigger say and the picture above shows that.
In this time-frame, we see that a number of moving averages have been keeping this pair afloat throughout last week, providing support on pullbacks. The 100 SMA (red) in particular has been a strong indicator, having reversed the declines a few times in the previous weeks.
A couple of hours ago, we saw this pair make another bearish move. That didn’t come from Crude Oil because Oil is slipping lower, so it came from the USD side of the pair, as the USD fell through an air pocket. But, the moving averages provided support once again, so we’re safe for now. Besides that, the stochastic indicator is oversold now and it’s reversing higher, so this might be the beginning of another move higher from these moving averages, let’s see.
- Check out our free forex signals
- Follow the top economic events on FX Leaders economic calendar
- Trade better, discover more Forex Trading Strategies
- Open a FREE Trading Account