The Downtrend Continues in Ethereum as Long as it Remains Below MAs
Ethereum tried to turn bullish this year, but the 100 SMA stopped the climb and now the price is again below all MA on the weekly chart
ETHEREUM was very volatile in 2017 and 2018, but the price action has quietened this year. BITCOIN continued the volatility this year, as it climbed from around $3,000 in Q1 to $1,380 in June. Ethereum also climbed to $362 during the same period, but compared to the previous two years, the chart doesn’t seem as volatile this year.
At some point, it looked like the trend was changing for Ethereum, as it was breaking above moving averages on the weekly chart. The 20 SMA (grey) and the 50 SMA (yellow) were providing support on the way up in 2017, so when the price broke above them, the buyers became increasingly confident.
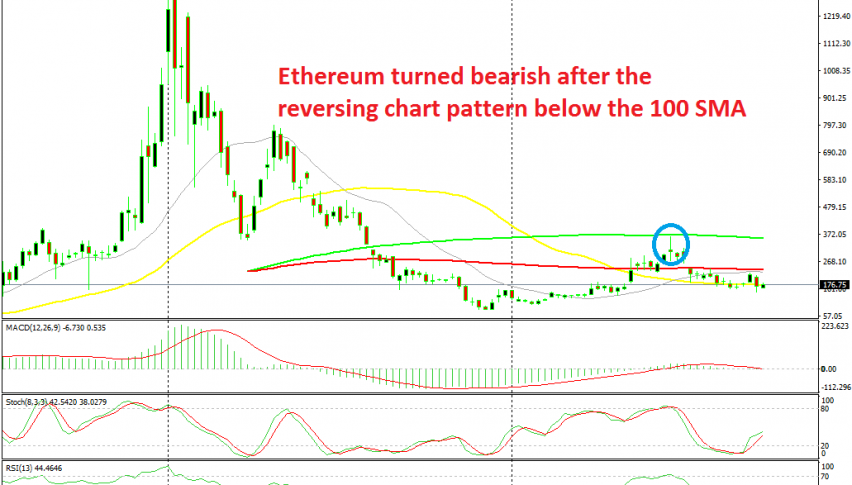
Buyers pushed above the 100 smooth MA (red) in May, which turned into support immediately after that. But, they couldn’t push the price above the 100 simple MA (green), which turned into resistance. Ethereum formed a doji candlestick on the weekly chart, which is a reversing signal, and the price reversed down.
The 100 smooth MA (red) tuned into resistance after that and last week Ethereum fell below the 50 SMA (yellow). This decline below moving averages puts the bullish trend of this year in question. Is the trend really bullish or was this just a retrace of last year’s big bearish trend? I myself favour the upside.
But, we might still see Ethereum and other major cryptos decline further before resuming the bullish trend. But, as long as the price remains below moving averages, sellers will be in charge. When the price moves above these MAs, then the buyers will start getting increasingly confident.
- Check out our free forex signals
- Follow the top economic events on FX Leaders economic calendar
- Trade better, discover more Forex Trading Strategies
- Open a FREE Trading Account