The Pullback Seems Complete on the EUR/USD Daily Chart
EUR/USD
[[EUR/USD]] turned quite bullish last week. The Euro doesn’t really have any reason to rally with the economy near stagnation and especially the manufacturing sector being in deep recession. But, the US ISM manufacturing also fell deeper into contraction in September, as last week’s report showed.
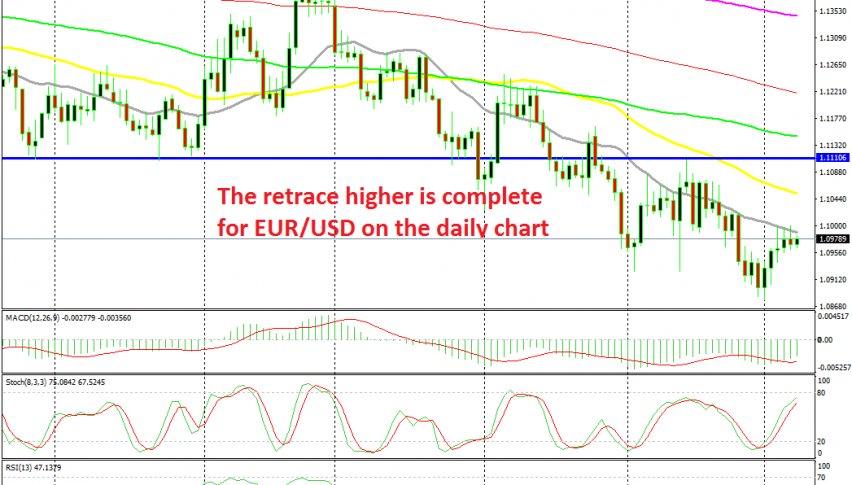
That sent the USD down and EUR/USD more than 100 pips higher. But, buyers are having trouble pushing the price above 1.10. They did try three times in the last three days, but failed every time. So it seems like this big round level has turned into a strong resistance now.
Besides that, the 20 SMA (grey) is also helping provide resistance. The 50 SMA (yellow) has usually been the main resistance indicator for EUR/USD, but now that the trend has picked up, the smaller period moving average has taken its place. The stochastic indicator is also overbought on the daily chart, which means that the pullback is complete. So, this might be a good opportunity to go short on this pair with a long term signal.
- Check out our free forex signals
- Follow the top economic events on FX Leaders economic calendar
- Trade better, discover more Forex Trading Strategies
- Open a FREE Trading Account


