Buying the Pullback in USD/CAD at the 100 SMA
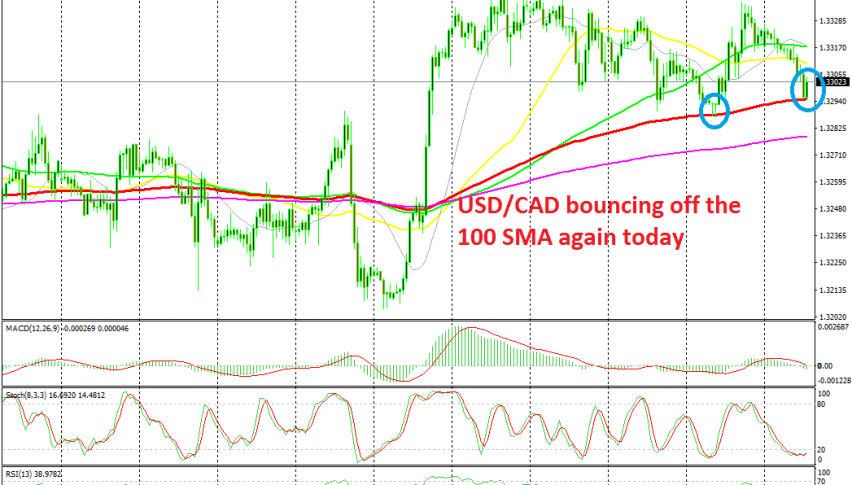
USD/CAD retreated lower today, but the 100 SMA provided support once again and is reversing the price higher
[[USD/CAD]] has traded mostly sideways this week. It made a big jump on October 1, worth around 140 pips, but the climb stopped and this week the price action has been mostly sideways. The highs have been getting lower and the lows have been getting slightly lower as well, albeit only marginally, so there’s no trend here.
What’s real in this chart setup is the support that USD/CAD has formed this week below 1.33. In the last three days we have seen the price spill below 1.33, but it has stopped just below that level and has reversed up, which means that a strong support zone has formed down there.
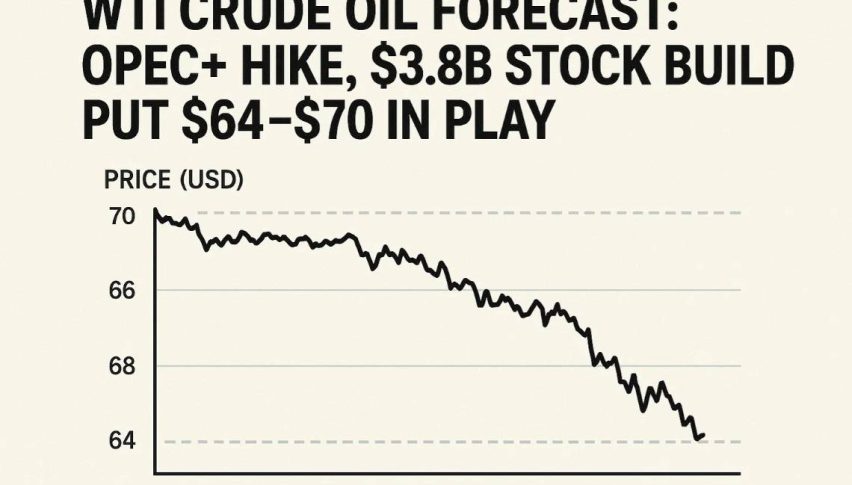
We saw the last dip to that zone just a while ago today. The CAD attracted some bids as Crude Oil jumped around $1 higher. I can’t find any reason for the jump in Oil, but it has stopped for now and the decline in USD/CAD has stopped.
The decline stopped right at the 100 SMA (red) on the H1 chart which has also turned, standing at the support zone and reversing the price higher for the second time today. So, we decided to take this opportunity and go long on USD/CAD, after missing yesterday’s opportunity.
- Check out our free forex signals
- Follow the top economic events on FX Leaders economic calendar
- Trade better, discover more Forex Trading Strategies
- Open a FREE Trading Account