Buying the Pullback in USD/JPY at the 50 SMA
USD/JPY has retraced lower today. But the trend is still bullish and the 50 SMA is providing support, so we decided to go long
[[USD/JPY]] turned quite bullish last week; the sentiment in financial markets turned positive after promising comments regarding the US-China trade negotiations and Brexit. Risk assets such as stock markets rallied, while safe havens declined.
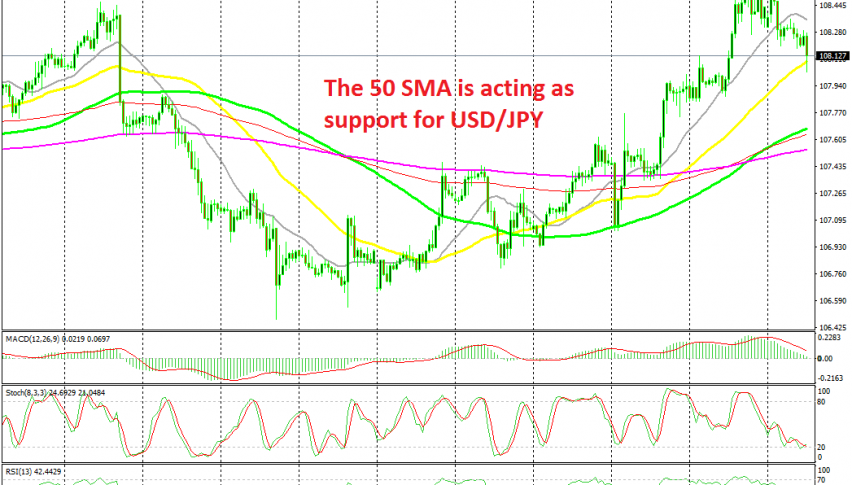
The USD turned bearish as well last week, but the JPY turned even more bearish, which sent this pair around 200 pips higher. Although, the climb stopped right below the 100 SMA (red) on the H4 time-frame chart last Friday and since then the price has slipped lower.
In the last hour, we heard rumours that China wants more talks before signing Donald Trump’s Phase One deal. This comes as a bit of a surprise, given that they sort of agreed for this trade deal late last week. As a result, USD/JPY slipped around 30 pips lower.
But, this doesn’t mean that the deal is off. This pair fell lower, but the decline is over now. The price pierced the 50 SMA (yellow) on the H4 chart but it pulled back above it, so that doesn’t count as a break. The 50 SMA is now acting as support and the price is oversold, which means that the decline is complete. We decided to take this opportunity and go long on USD/JPY.
- Check out our free forex signals
- Follow the top economic events on FX Leaders economic calendar
- Trade better, discover more Forex Trading Strategies
- Open a FREE Trading Account


