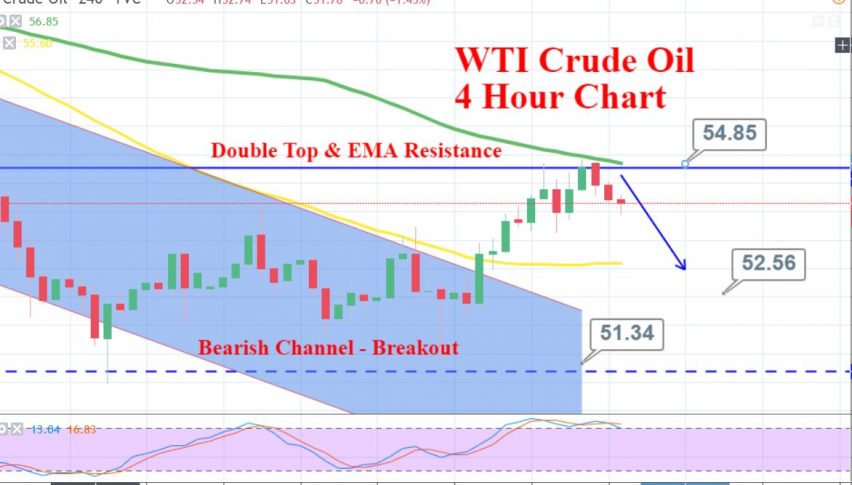
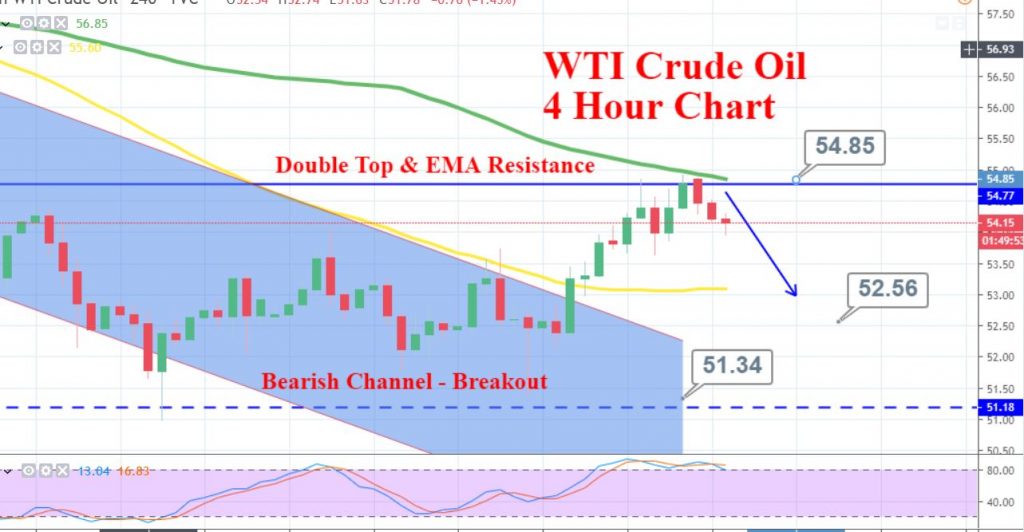
WTI Crude Oil – Double Top & EMA Pushing Black Crack Lower
Crude oil is taking a slight U-turn below 54.85 level after testing double top level and the 50 periods EMA. Black crack was stuck in an...
What’s up, traders.
WTI crude oil traded bullish after violating the bearish channel at $53, the long held resistance level. The latest developments between the US and China are also keeping the black crack prices bullish as with no trade war, the world’s biggest oil consumer China may continue importing oil at its full potential.
Crude oil imports of China surged in the month of September by 10.8% from a year earlier. It looks like refiners ramped up production amid steady profit margins and a strong fuel market.
Oil prices gained further support after the General Administration of Customs reported on Monday that China, the world’s topmost oil importer, purchased nearly 41.24 million tonnes of oil, equal to 10.04 million barrels per day (bpd).
Partial Settlement of Trade Dispute
The robust macroeconomic data from the United States made the US Dollar stronger on Friday and put pressure on gold prices that day. Following Sino-American trade discussions on Friday, Donald Trump said that the US & China had reached a “Phase 1 Deal.”
The United States was due to raise tariffs on Chinese goods to 30% next week, but after the meeting between Trump and Chinese Vice Premier Liu He on Friday, the US agreed to suspend its next tariff hike on Chinese goods. With this, crude oil prices are likely to gain further support.
WTI Crude Oil – Technical Analysis
On the technical side, crude oil is taking a slight U-turn below 54.85 level after testing double top level and the 50 periods EMA. Black crack was stuck in an overbought range and need this retracement to continue with its bullish trend.
Below 54.85, WTI crude oil prices may trade bearish until 54.50 whereas, a bearish breakout of 54.50 can extend sell-off until 53, the 100 periods EMA support level.
Support Resistance
54.1 55.37
53.26 55.8
51.99 57.07
Pivot Point 54.53
WTI Crude Oil – Trade Idea
The idea is to stay bearish below 54.50 with a stop loss of over 54.85 and take profit at 53.50. Good luck!
- Check out our free forex signals
- Follow the top economic events on FX Leaders economic calendar
- Trade better, discover more Forex Trading Strategies
- Open a FREE Trading Account