Daily Brief, Oct 18 – Everything You Need to Know About Gold
Gold prices were opened at $1490.020 and have placed a high of $1497.320 and low of $1483.40 until now. It is currently trading at $1491.070.
Gold prices opened at $1490.020 and have placed a high of $1497.320 and low of $1483.40 until now. It is currently trading at $1491.070. At 1:00 GMT, the Treasury International Capital (TIC) Long-term Purchases from the US Department of Treasury came in negative for the month of September as -41.1B against 74.3B expectations.
At 17:30 GMT, the US Building House Permits came as 1.39M against 1.34M expectations and supported the US Dollar.
On the other hand, the number of new buildings that began construction in the month of September was 1.26M against 1.32M expectations weighed the US Dollar. The US job claims for September came as expected, 214K.
At 18:15 GMT, the Industrial Production for September was dropped to -0.4% against -0.1% expectations. The capacity utilization rate also dropped to 77.5% against 77.7% expectations.
The hope for the third rate cut by Fed this year increased after the weak macroeconomic data on Thursday weighed on the greenback. The US dollar index moved to its lowest level since August 26; hence, Gold prices moved in a bullish trend.
The upward movement of Gold was suppressed by the news from Turkey that it has decided on a ceasefire on Kurdish forces. The news sucked away the demand for safe-haven from the market and caused a decline in the rising rate of gold.
Support Resistance
1484.38 1498.39
1476.9 1504.92
1462.89 1518.93
Key Trading Level: 1490.91
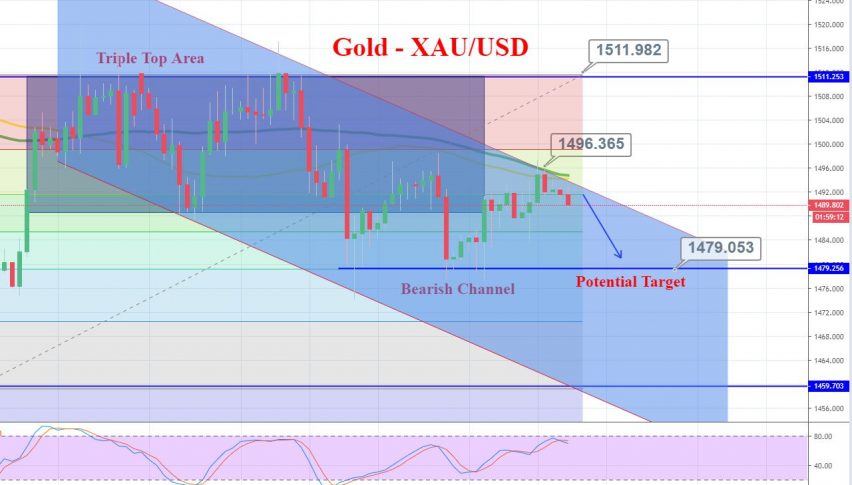
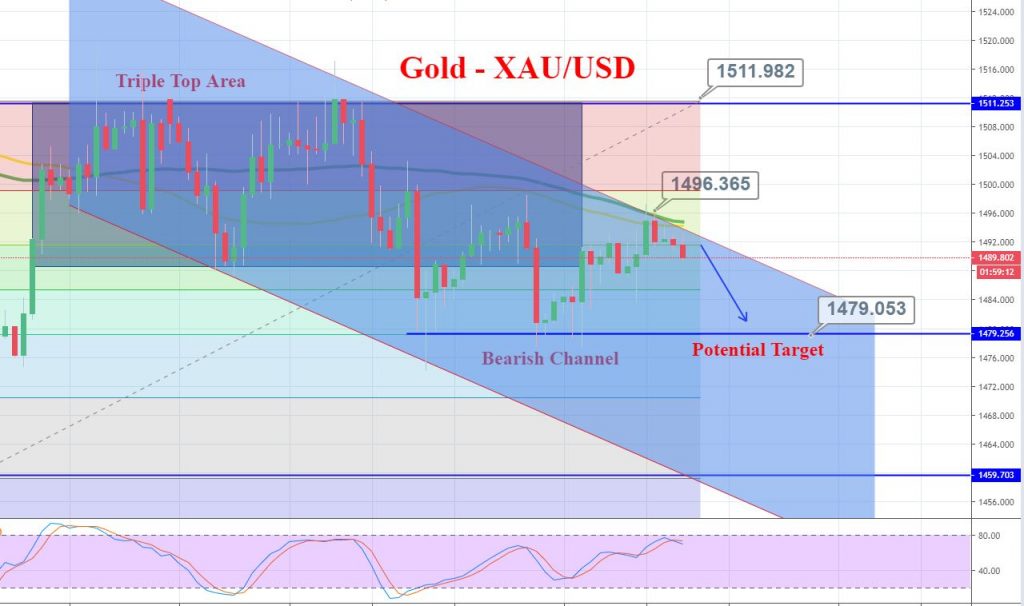
GOLD – XAU/USD – Forex Trading Signal
On Friday, Gold continues to trade below 1,497 resistance. This level has now become double the top level on the 4-hour chart. Whereas, the bullish trendline is supporting the metal around 1,488 today.
Overall, it’s an ascending triangle pattern, which typically breaks out on the upper side, which may help us determine further trends in Gold. A bullish breakout of 1,497 level may lead gold prices towards 1,503 today.
All the best!
- Check out our free forex signals
- Follow the top economic events on FX Leaders economic calendar
- Trade better, discover more Forex Trading Strategies
- Open a FREE Trading Account