Daily Brief, Oct 23 – Everything You Need to Know About Gold
Gold prices were opened at $1484.49 and have placed a high of 1488.98 and low of 1480.81 until now. Gold is trading at $1487.84 as of....
Gold prices opened at $1484.49 and have placed a high of $1488.98 and a low of $1480.81 until now. Gold is trading at $1487.84 as of writing and has shown a bullish trend for Tuesday. Gold prices remained in a tight range on Tuesday due to a lack of any shocking news related to trade disputes between China and the United States.
Economic Events Up Next
As far as the macroeconomic data is concerned, at 19:00 GMT, the Existing Home Sales of United States for the month of September came at 5.38M against 5.45M of expectations. At 19:05 GMT, the Richmond Manufacturing Index came at 8 against the expectations of -7 for the month of September.
The drop in existing home sales in the month of September indicated that even lower refinancing rates didn’t have much impact on the economy due to other concerns. And after the release of this report, the prices of gold fell.
HPI m/m – 13:00 GMT
The FHFA will release the House Price Index at 13:00 GMT. The HPI is a leading indicator of the housing industry’s health because rising house prices attract investors and spur industry activity.
Economists are expecting a 0.4% growth in September versus 0.4% beforehand.
Brexit Updates
On the Brexit front, British Lawmakers rejected the government’s attempt to pass its Brexit deal on Tuesday. House of Commons was given a period of three days to debate the Withdrawal Agreement Bill, and that timetable was voted against by the legislators with a majority of 322-308. The votes made it almost impossible for PM Boris Johnson to accomplish Brexit on the said deadline of October 31, 2019. Gold prices jumped a little after this Brexit news on Tuesday.
Gold prices showed up and down movement throughout the day. The downward movement was caused by the weak macroeconomic data from the US side, and an upward trend was followed by the hopes of a further interest rate cut by the Fed in the next meeting.
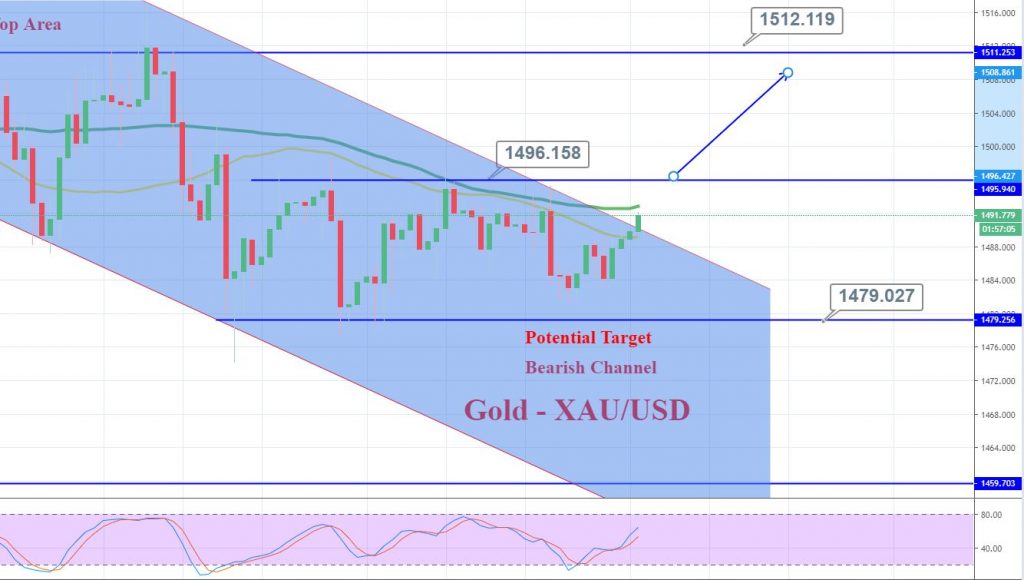
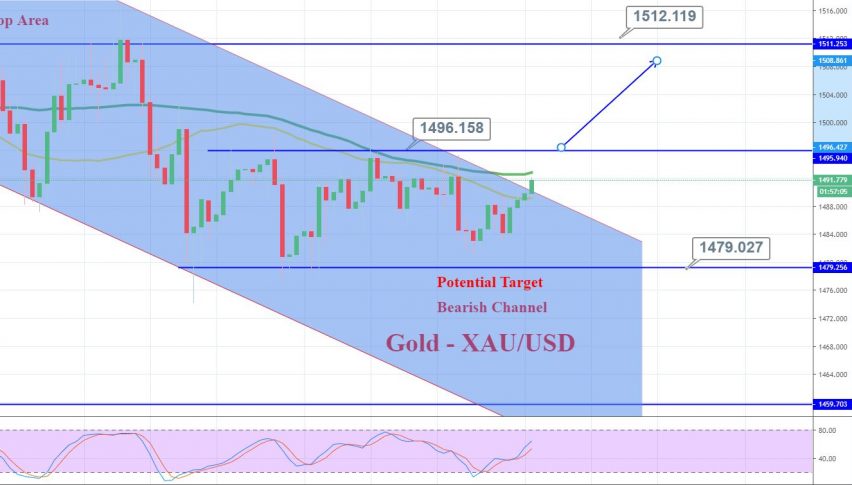
GOLD – XAU/USD – Technical Levels
Support Resistance
1484.27 1490.52
1480.41 1492.91
1474.16 1499.16
Key Trading Level: 1486.66
Gold – XAU/USD – Forex Trading Signal
Gold gained support near the 1,482 area and soared over the weakening US dollar. Gold is now trading below the 1,490 resistance level, which is working as a substantial resistance. The level is extended by 61.8% Fibonacci retracement level. Today, violation of this level can extend further buying until 1,495. On the lower side, support stays at 1,487.
- Check out our free forex signals
- Follow the top economic events on FX Leaders economic calendar
- Trade better, discover more Forex Trading Strategies
- Open a FREE Trading Account
- Read our latest reviews on: Avatrade, Exness, HFM and XM
Related Articles


Sidebar rates
Related Posts
