MAs Keep GBP/USD Subdued
GBP/USD has slipped lower in the last few days and MAs have turned from support into resistance now
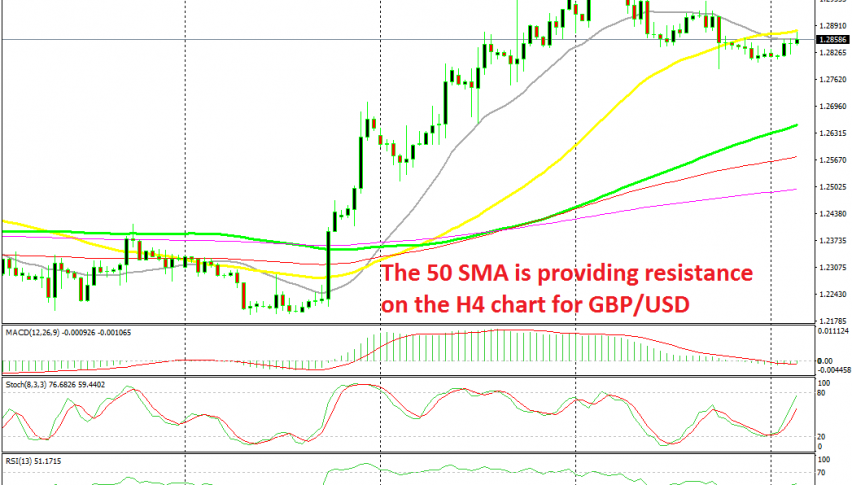
[[GBP/USD]] turned extremely bullish in the last two weeks,surging more than 800 pips higher as Boris Johnson and the EU reached a Brexit deal. The price even pierced above 1.30 fro a brief period before returning down. But, the price retreated in the last few trading days, after the Brexit deal didn’t pass the meaningful vote in the UK parliament.
During the surge, the 20 SMA turned into resistance for this pair on the H4 chart and kept pushing the price higher. But, as the price slipped below this moving average last week, the 20 SMA turned into resistance. In the second half of the week, the price slipped below the 50 SMA (yellow) as well and has been trading below it since then. Now, the 50 SMA has turned into resistance as well.
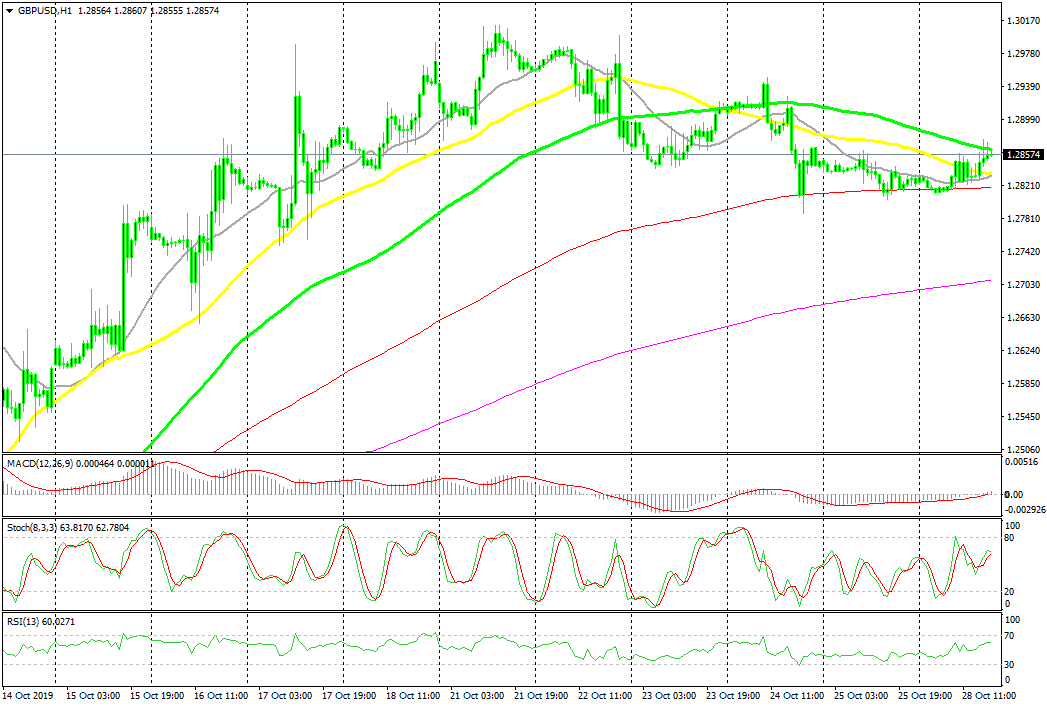
The price has formed a reversing pattern below the 100 SMA
Switching tot he H1 chart, we see that here is the 100 SMA (green) which is providing resistance now. The 50 SMA used to provide support for this pair on this time-frame when the price was surging, but it seems that the 100 SMA is turning into resistance. the price has formed two upside-down pin candlesticks which are reversing signals. So, I am thinking of going short on GBP/USD right here, since buyers are having difficulties pushing above the 100 SMA.
- Check out our free forex signals
- Follow the top economic events on FX Leaders economic calendar
- Trade better, discover more Forex Trading Strategies
- Open a FREE Trading Account


