MAs Keep Pushing USD/CAD Down Again This Week
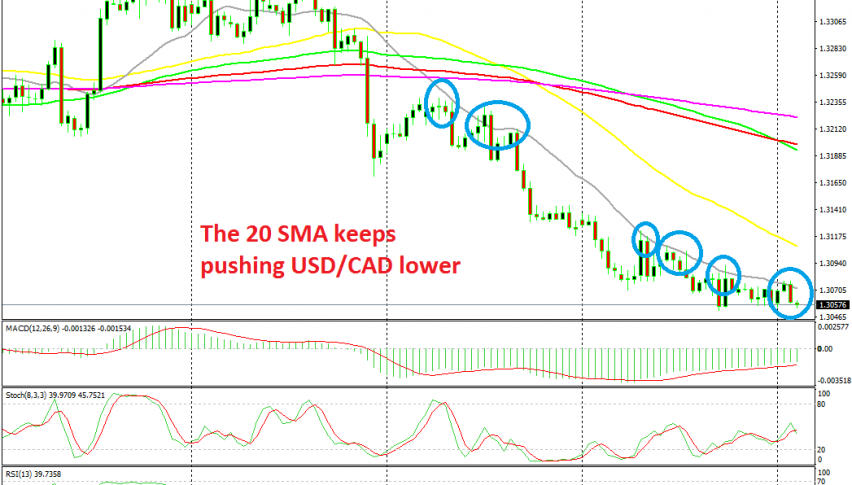
USD/CAD has been bearish all this month and moving averages are keeping it that way

On Friday I posted about USD/CAD and how moving averages are keeping it bearish. This pair reversed down after some strong employment figures from Canada early this month and it has been slipping lower in the last three weeks, as Crude Oil has turned bullish on comments from OPEC that the cartel will cut production further.
As a result, this pair has been pretty bearish since early this month. As I mentioned, moving averages are doing a good job in keeping this pair as it is, bearish. They have been providing resistance on pullbacks higher, bringing an end to them and reversing the price down. On the chart above, we see that here it’s the 20 SMA (grey) which has been doing that job.

The 100 SMA has been providing resistance on the H1 chart
Switching to the H1 time-frame, we can see that the 50 SMA (yellow) and the 100 SMA (green) have been providing resistance. When the trend has been strong, the smaller period moving average, the 50 MA has taken up that job. When the decline has slowed, such as in the last few days, the 100 SMA has reversed the price lower.
This morning, we saw a retrace higher on the H1 chart, but the 100 SMA did a good job and the price reversed below it after a few doji candlesticks. So, this pair remains bearish as long as it stays below these moving averages and the trading plan is simple, sell USD/CAD at one of these MAs when it retraces higher.
- Check out our free forex signals
- Follow the top economic events on FX Leaders economic calendar
- Trade better, discover more Forex Trading Strategies
- Open a FREE Trading Account


