A Quick Trade Off the Top of the Range in Gold
Gold was climbing higher this morning as the USD was under some pressure, but It reversed at the top of the range at the 100 SMA
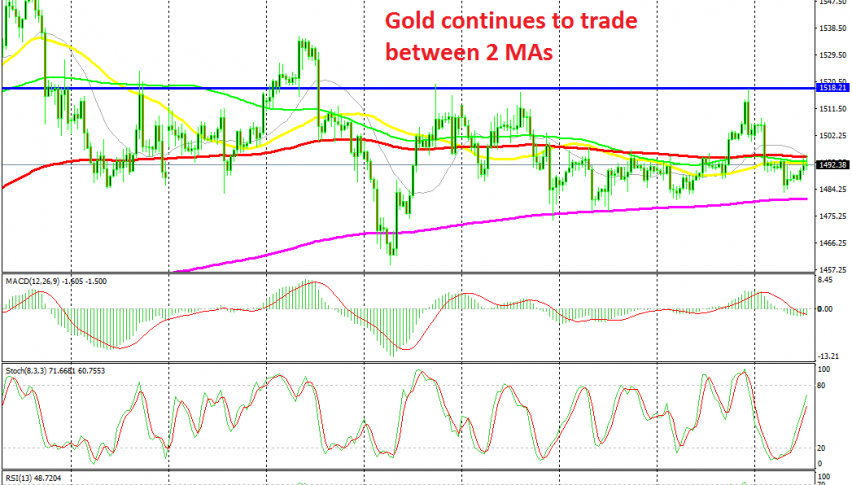
GOLD has been trading in a range in the last three weeks. It moved higher towards the end of last week, but the resistance area at $1,518 reversed the price down, sending it back inside the range. The range has been defined by the 200 SMA (purple) at the bottom on the H4 chart and the 100 SMA (red) at the top.
The price entered the range between these two moving averages on Monday and yesterday it slipped lower, towards the bottom of the range. But the price reversed above the 200 SMA and today it climbed higher. At some point about an hour ago, the price reached the 100 SMA.
That moving average provided solid resistance once again and Gold fell about $5 lower. But, that was also due to the US GDP report which was released at the same time as the 200 SMA was providing resistance. The GDP for Q3 came stronger than expected and the USD jumped higher, sending Gold lower. The price hit our TP target a few minutes after we opened our sell signal, so we booked profit pretty quick.
- Check out our free forex signals
- Follow the top economic events on FX Leaders economic calendar
- Trade better, discover more Forex Trading Strategies
- Open a FREE Trading Account


