EUR/USD Forms a Bearish Reversing Pattern Below the 50 SMA
EUR/USD turned bearish last week after being bullish for 3 weeks and now the 50 SMA has turned from support to resistance
[[EUR/USD]] turned really bullish in the first three weeks of this month, especially after the US ISM manufacturing fell deeper into contraction, which prompted fears that US manufacturing might follow German manufacturing down the sink hole. But, last week the trend reversed and this pair turned lower.
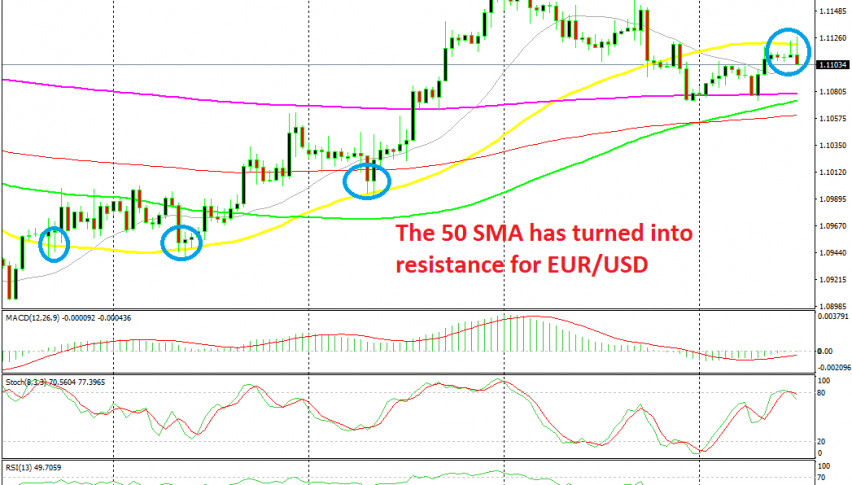
The decline continued until the price reached the 200 SMA (purple) on the H4 chart, which has turned into support for EUR/USD. The price bounced higher twice off this moving average and today it reached the 50 SMA (yellow), which seems to have now turned into resistance.
This moving average was defining the trend, providing support on the way up. But after it has been broken, the 50 SMA has turned into resistance. Now, a bearish reversing signal has formed on this time-frame, with stochastic overbought and two reversing H4 candlesticks, such as the previous doji and the current upside-down hammer. We are already short on EUR/USD and this chart setup is pointing down, so we will hold on to our trade.
- Check out our free forex signals
- Follow the top economic events on FX Leaders economic calendar
- Trade better, discover more Forex Trading Strategies
- Open a FREE Trading Account
- Read our latest reviews on: Avatrade, Exness, HFM and XM
Related Articles


Sidebar rates
Related Posts
