The 50 SMA Turns Into Support for NZD/USD on the Daily Chart
NZD/USD retraced lower last week, but the 50 SMA held the decline and this pair turned bullish on Wednesday after the FED meeting
[[NZD/USD]] has been bearish for a long time as the global economy has been weakening and the trade war between US and China has been escalating. As a result, risk assets have been declining, especially the Kiwi and the Aussie which are directly connected to the trade war, since they export a lot of raw materials to China.
But, US and China reached a partial trade deal called “Phase One” earlier this month and the sentiment improved instantly. NZD/USD reversed higher and it broke above the 50 SMA (yellow) on the daily chart. The Brexit deal that Boris Johnson reached with the EU also helped the sentiment in financial markets.
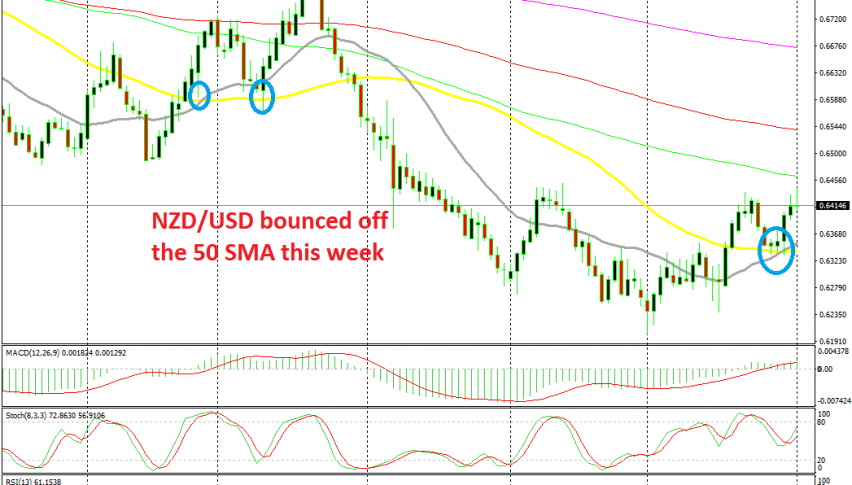
But, the climb stopped at last month’s highs at 0.6430-40. The stochastic indicator was overbought, so it was time for a retrace before the next bullish move. The retrace took place last week and NZD/USD lost around 100 pips, but the 50 SMA (yellow) turned into support on the daily chart.
The price formed two doji candlesticks above that moving average on Monday and Tuesday, which are reversing signals and the reverse took place on Wednesday evening after the press conference from FED chairman Jerome Powell. Now, this pair is pretty bullish, but we heard rumours on Bloomberg yesterday, saying that China doesn’t think they can go ahead with the trade deal as long as Donald Trump is President of the US. This might reverse the sentiment and NZD/USD, but for now the trade deal seems to be on the right track.
- Check out our free forex signals
- Follow the top economic events on FX Leaders economic calendar
- Trade better, discover more Forex Trading Strategies
- Open a FREE Trading Account
- Read our latest reviews on: Avatrade, Exness, HFM and XM
Related Articles


Sidebar rates
Related Posts
