The Retrace Up in EUR/USD Should Be Over Soon
EUR/USD has retraced 300 pips higher last month, but the retrace might be complete and over soon.

The USD turned pretty bearish in October after the ISM manufacturing report showed that manufacturing activity fell deeper into contraction in September. The ISM indicator remained in contraction in October, which increases odds that this sector might fall in recession, just like in Germany.
The FED cut interest rates as well, for the third time in the last three meetings. As a result, the USD has been bearish and EUR/USD has been bullish, climbing around 300 pips from the bottom to the top. But, the main trend is still pretty bearish and the pullback higher seems complete now.
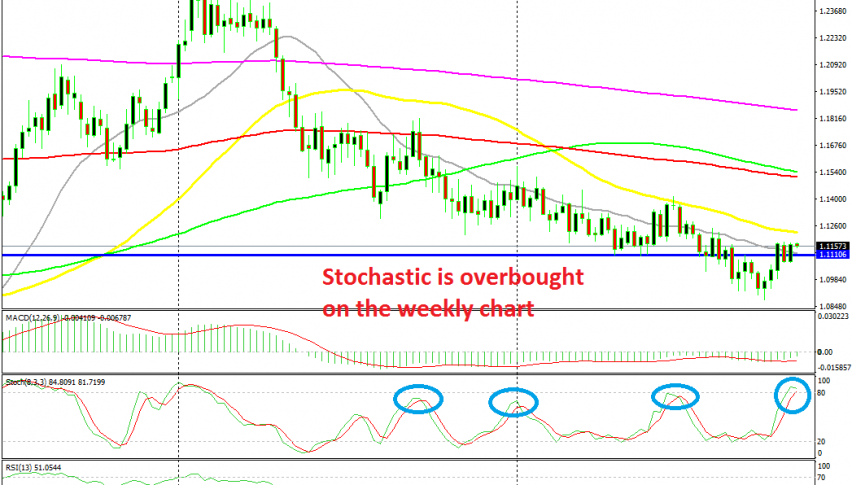
The stochastic indicator is overbought on the weekly chart and the price is trading between 2 moving averages, the 20 SMA (grey) and the 50 SMA (yellow). We have seen this pair reverse many times from between these 2 MAs, but most importantly, every time stochastic became overbought the buyers gave up and sellers came in, as shown by the circles in the chart above.
Powell didn’t leave much room for rate hikes anytime soon, but at least the FED is done with cutting rates for now. On the other hand, the European Central Bank ECB cut rates in the previous meeting and started buying financial assets this month. They will likely ease further as the Eurozone economy keeps weakening, so the situation is much more gloomy for the Euro than it is for the USD.
But, we might see this pair reach the 50 SMA on the weekly chart and reverse down from there. So, we will wait for a reversing signal such as the doji candlestick back in June below the 50 MA, which was followed by a reversal down.
- Check out our free forex signals
- Follow the top economic events on FX Leaders economic calendar
- Trade better, discover more Forex Trading Strategies
- Open a FREE Trading Account


