NZD/USD Should Remain Above MAs if it Wants to Stay Bullish
NZD/USD has been bullish since early October but let's see if MAs hold as support on the daily chart and NZD/USD remains bullish
[[NZD/USD]] has been trading on a bearish trend since April last year but this month we have seen a decent retrace higher, which might be the beginning of a trend reversal. We saw an attempt at reversing higher in September in this pair, as the sentiment improved in financial markets due to the quiet tones from US and China on the trade war, following a really heated summer.
But, the bearish trend resumed again, although October’s pullback seems more convincing. NZD/USD retraced higher in the first week of last month, and after finding resistance at the 20 SMA on the daily chart, the price broke above it. The 50 SMA (yellow) provided resistance as well once, but it was broken after US and China reached the partial trade deal, which improved the sentiment a great deal.
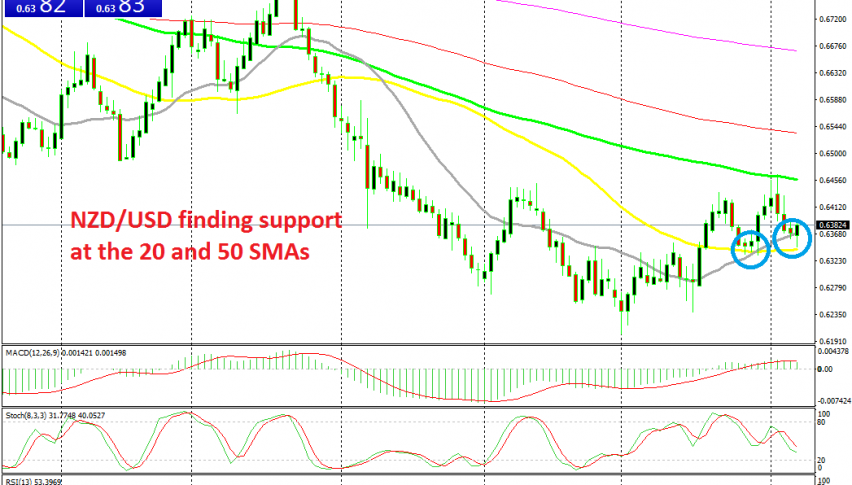
Risk assets such as the NZD benefit when the sentiment is positive and this pair has remained bullish. The 50 SMA (yellow) and the 20 SMA (grey) turned into support last week after the retrace and this pair bounced off of them after forming two doji candlesticks, which are reversing signals.
But, the climb ended at the 100 SMA (green) and this week we have seen this pair retrace lower. So now, the 20 and 50 SMAs will be tested again. If they hold, then the bullish turned will likely continue for this pair. We might open a buy signal here if we see the price forming another reversing candlestick.
- Check out our free forex signals
- Follow the top economic events on FX Leaders economic calendar
- Trade better, discover more Forex Trading Strategies
- Open a FREE Trading Account
- Read our latest reviews on: Avatrade, Exness, HFM and XM
Related Articles


Sidebar rates
Related Posts
