Selling the Retrace in AUD/USD at the 200 SMA
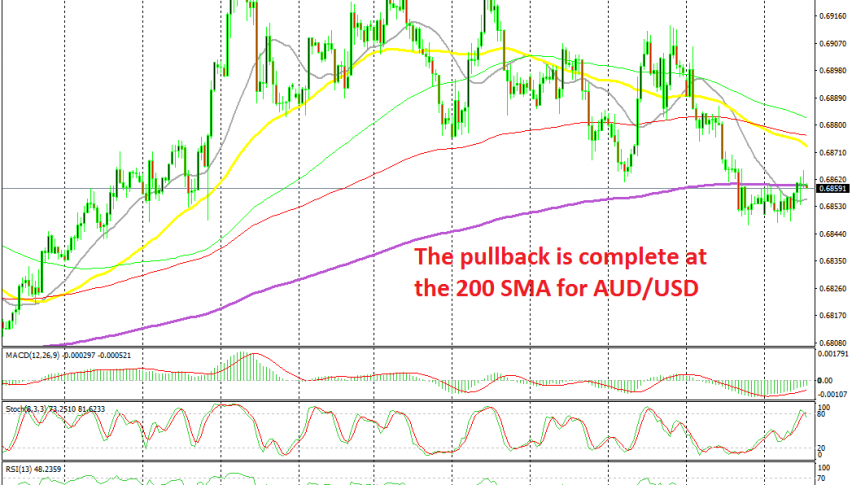
AUD/USD has turned bearish this month and we decided to sell the pullback at the 200 SMA on the H1 chart

[[AUD/USD]] turned pretty bullish in October. This pair has been bearish for a long time, but the US ISM manufacturing showed that the contraction deepened in this sector. The FED also cut interest rates for the third time in three meetings and remained dovish, which was another factor that caused the USD to turn bearish.
The hopes for a trade deal between US and China also improved the sentiment for the risk assets such as commodity dollars. As a result, this pair climbed around 250 pips during last month, but the uptrend ended with October and this pair AUD/USD has turned bearish again.
During the uptrend last month, moving averages were providing support on pullbacks. Now, it seems like moving averages have turned into resistance. Overnight, we have seen a retrace higher on this pair, which still seems very weak, especially when compared to the retrace on other pairs. This is a strong sign that the pressure is still on the downside for this pair.
Besides that, the 200 SMA (purple) is providing resistance on the H1 chart. The previous candlestick closed as an upside-down pin, which is a reversing signal after this retrace. The stochastic indicator is also overbought, so the chart setup points to a bearish reversal soon and we decided to go short on this pair from the 200 SMA.
- Check out our free forex signals
- Follow the top economic events on FX Leaders economic calendar
- Trade better, discover more Forex Trading Strategies
- Open a FREE Trading Account


