NZD/USD Continues to be Stuck Between 2 MAs for More Than a Month
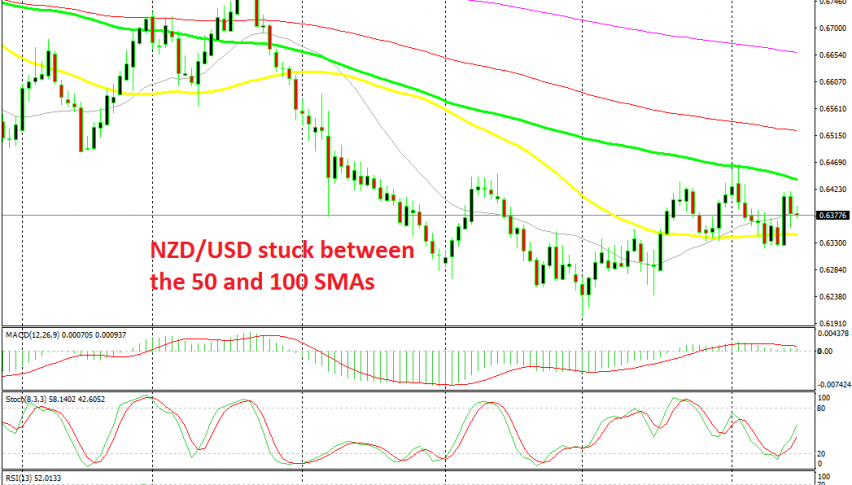
NZD/USD has been stuck between the 50 and 100 SMAs and it bounced off the 50 SMA on Wednesday after the RBNZ kept rates on hold

[[NZD/USD]] has been bearish for 18 months now, but it turned bullish in October, as the USD turned bearish on a contracting manufacturing sector. The 50 SMA provided resistance for some time on the daily chart as the price was climbing up, but it was broken without much resistance by the middle of October.
The price continued higher, but reversed at 0.6435, after forming a doji candlestick, which is a bearish reversing signal. Some traders might have thought that the larger bearish trend was about to resume, but I pointed out back then, that the 50 SMA might turn into support for NZD/USD.
That’s exactly what it did, the price found support at that moving average and formed a couple of doji candlesticks, which in this case were bullish reversing signals after the decline. NZD/USD bounced off the 50 SMA, but it found resistance at the 100 SMA (green) on this time-frame.
This month, NZD/USD slipped lower as the sentiment turned negative again, but the 50 SMA held for the second time. Then, on Wednesday we saw this pair jump higher after the Reserve Bank of New Zealand held interest rates unchanged, while expectations were for another rate cut of 0.25%, which would bring interest rates down to 0.75%.
So, NZD/USD is stuck between these two moving averages and now it is headed towards the 100 SMA again. Anyway, we will try to play both sides if we get reversing confirmations.
- Check out our free forex signals
- Follow the top economic events on FX Leaders economic calendar
- Trade better, discover more Forex Trading Strategies
- Open a FREE Trading Account


