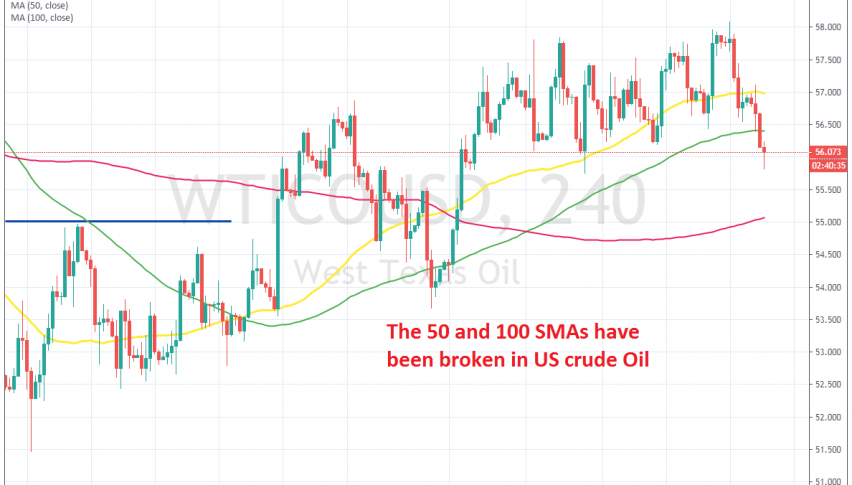
WTI Crude Oil Breaks Below $56 and the 100 SMA
Crude Oil has been bullish for a month now, but it reversed down yesterday and today it has broken the MA's which were acting as support

Crude Oil has been bullish since the middle of last month. It made a reversal above the $50 level, which shows that the support area above that level continues to remain strong. The price moved above moving averages, which turned into support, especially the 50 SMA (yellow).
Yesterday, US WTI crude Oil broke above $58 for a moment, but the price formed a doji candlestick just below that level, which is a reversing signal. The signal worked well, as the price reversed after that and crude Oil turned pretty bearish, losing more than $2 since then.
The price broke below the 50 SM (yellow) and the 100 SMA (green), although the 100 SMA was broken at the end of October and the price fell as far below it as it is now, only to reverse again and resume the bullish trend. So, there’s a chance that we might see another bullish reversal from here.
If not, then the 200 SMA (purple) will be the target, which comes at $55. If we hear positive comments on the US-China trade deal when the price gets down there, then we might be persuaded to go long on US crude Oil. So, follow us for live signals on crude Oil.
- Check out our free forex signals
- Follow the top economic events on FX Leaders economic calendar
- Trade better, discover more Forex Trading Strategies
- Open a FREE Trading Account


