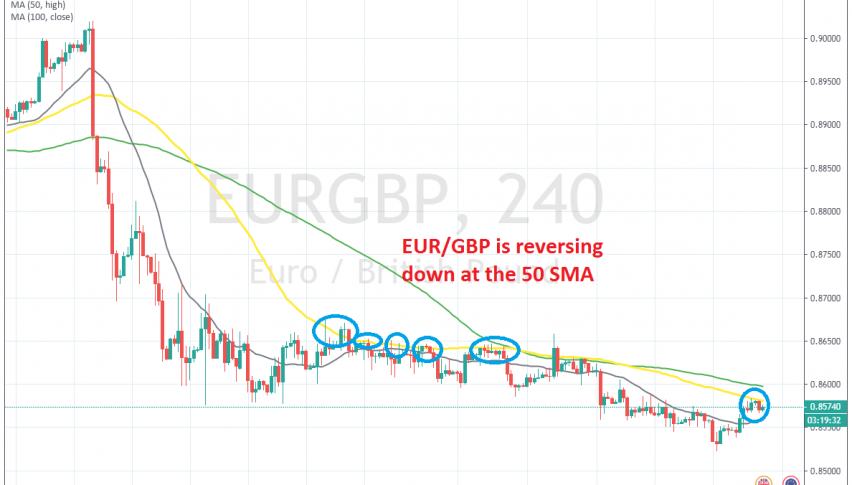
EUR/GBP Finds Resistance at the 50 SMA Again
EUR/GBP was retracing higher yesterday, but we decided to sell this pair at the 50 SMA, so we are short now

Yesterday EUR/GBP was retracing higher and we decided to open a sell forex signal in this pair. This pair turned bearish by the middle of October after UK Prime Minister Boris Johnson and the EU reached a Brexit deal, which sent the GBP surging and EUR/GBP diving lower.
The trade agreement between US and China also helped improve the sentiment back then, although the “Phase One” deal is not so certain now. During the first couple of weeks, the trend was really strong, which cam be observed by the 20 SMA (grey) which was providing resistance on the H4 time-frame chart.
The trend slowed in the following weeks and the large moving averages, such as the 50 SMA (yellow) and the 100 SMA (green) turned into resistance once they caught up with the price. Last week, the downtrend resumed again after a consolidation period, but yesterday this pair was retracing higher.
We decided to go short on EUR/GBP when the price reached the 50 SMA. The retrace was complete, with stochastic being overbought on the H4 chart, so a bearish reversing pattern had formed. Today we see that the price is reversing down, so the 50 SMA did a good job in providing resistance. Now we are holding on to our trade here.
- Check out our free forex signals
- Follow the top economic events on FX Leaders economic calendar
- Trade better, discover more Forex Trading Strategies
- Open a FREE Trading Account


