WTI Crude Oil Double Bottom Level Supports – Brace for a Buy Trade
The WTI crude oil prices inched up ad recovered after the Chinese upbeat PMI data as well as the expectation that the Organization of the...
WTI crude oil prices inched up and recovered after the Chinese upbeat PMI data as well as the expectation that the Organization of the Petroleum Exporting Countries (OPEC) and partners will likely extend output cuts at their meeting later this week.
WTI crude oil surged on Monday after China’s official Manufacturing Purchasing Managers’ Index (PMI) released on Saturday came in at 50.2, showing expansion for the first time in seven months and indicating an increase in fuel demand. On Monday morning, the private Caixin/Markit PMI came in at 51.8, up from 51.7 in October and higher than the expected 51.4.
Investors are keeping their eyes on the meeting on December 5 and 6 where the OPEC and its partners are expected to agree to extend the existing oil output cuts by about 400,000 barrels per day (BPD) to 1.6 million BPD and to extend the cuts till at least June 2020. The group’s current supply cuts of 1.2 million bpd started in January and will expire at the end of March 2020.
Crude oil prices jumped 5% last Friday because Russia sent out mixed signals on its commitment to extend production cuts, and US President Donald Trump signed two bills to support Hong Kong protests against Beijing, adding to the trade tensions between the world’s two biggest economies.
At the Sino-US trade front, in November, WTI crude oil prices increased due to the optimism regarding the two nations reaching a trade deal by the end of the year. However, this latest development escalated tensions about the trade deal, leaving a negative impact on WTI crude oil prices.
Daily Support and Resistance
S3 49.92
S2 53.06
S1 54.23
Pivot Point 56.19
R1 57.37
R2 59.33
R3 62.47
WTI Crude Oil – Forex Trading Signal
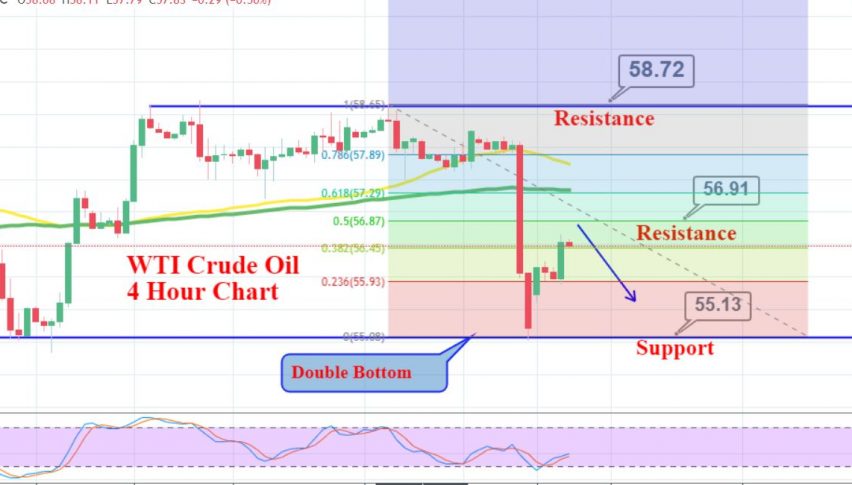
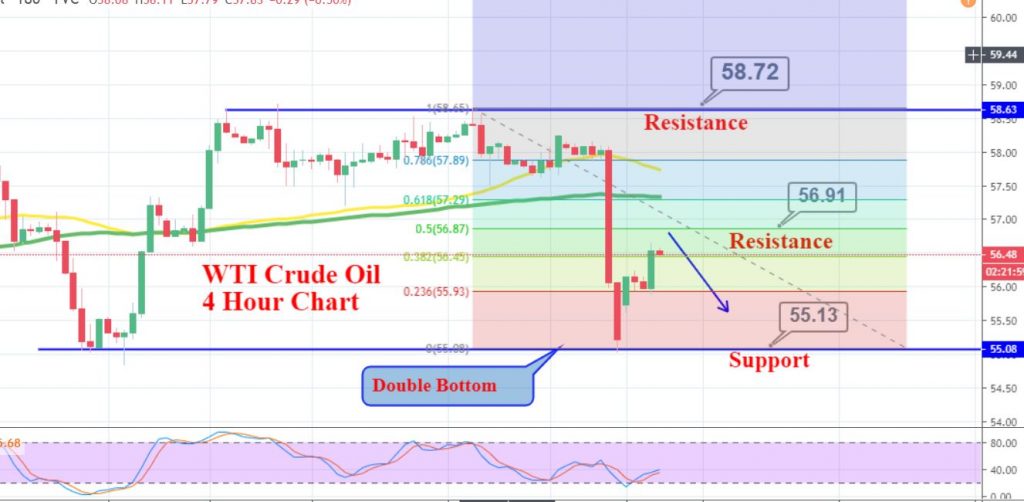
WTI crude oil has faced a double bottom support level of around 55.08 on the 3-hour chart. Closing of candles above this level is suggesting chances of a bullish retracement.
On the upper side, crude oil is likely to test 50% Fibonacci level around 56.90, and above this, oil prices can soar to 57, the 61.8% Fibonacci resistance area.
Let’s look for a buy trade above 55.95 today.
Good luck!
- Check out our free forex signals
- Follow the top economic events on FX Leaders economic calendar
- Trade better, discover more Forex Trading Strategies
- Open a FREE Trading Account