Buying the Pullback in US Oil at the 50 SMA


Crude Oil has been on a bullish trend since the beginning of October, when US WTI crude turned bullish at $51. Since then, US crude has been trading inside an ascending channel which took the price close to $60. We did see a dip in the last day of November, after Russian energy minister Novak suggested that OPEC+ postponed any further production cuts until later next year.
But OPEC decided to cut crude oil production nonetheless. It was a small cut, of 50k barrels/day, but it had an impact on oil prices anyway. US WTI oil jumped more than $2 higher on Friday after it became evident that OPEC+ was cutting production again.
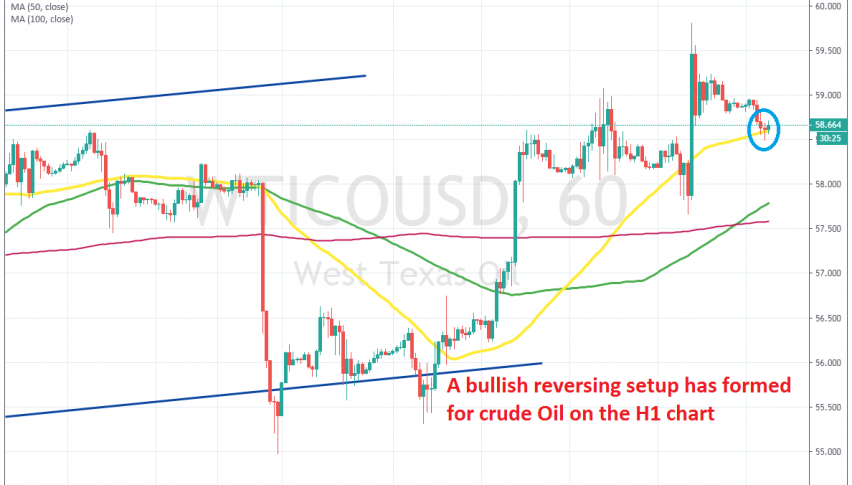
But, the buyers couldn’t push above the big round level at $60, which is a psychological barrier. WTO oil has retreated and slipped more than $1 lower so far.
Although, it seems like the 50 SMA (yellow) is providing support on the H1 time-frame. The price formed a small doji candlestick above that moving average, which is a bullish reversing signal after the pullback. So, we decided to go long on this bullish reversing pattern on the H1 chart.