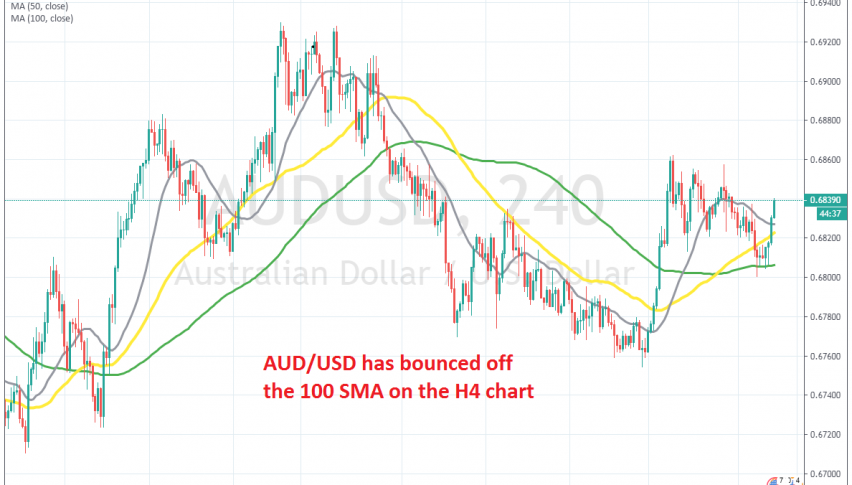
AUD/USD Bounces Off the 100 SMA After the Pullback Down Completed
AUD/USD retraced lower this week as the sentiment deteriorated a bit, but the 100 SMA held as support and AUD/USD bounced off of it today

[[AUD/USD]] turned bullish in October for the reasons that we have mentioned many times, such as comments regarding the Phase One deal, which came as a bit of a surprise and helped the sentiment improve considerably in forex, at a time when the global economy is still weakening. Although, the trend turned bearish in November, as the USD gained some strength.
Moving averages such as the 20 SMA (grey) and the 50 SMA (yellow) turned into resistance and stopped the buyers from pushing higher during retraces. But, sellers couldn’t make new lows, which was a sign that the trend was still bullish and buyers were going to come back at some point.
That point in time came after the US ISM manufacturing report showed further weakness in this sector of the US economy on December 1, and AUD/USD surged around 100 pips higher as the USD turned bearish again. Last week, the price was consolidating while earlier this week we saw a retrace higher, as the sentiment turned slightly negative.
The price fell to 0.68 and stopped right there. The 100 SMA (green) turned into support for this pair on the H4 chart. The price formed a couple of doji/hammer candlesticks on this time-frame, which are reversing signals and eventually, AUD/USD reversed higher. This pair has bounced around 40 pips higher now, so buyers are in control again. Too bad we missed that opportunity to go long last night.
- Check out our free forex signals
- Follow the top economic events on FX Leaders economic calendar
- Trade better, discover more Forex Trading Strategies
- Open a FREE Trading Account


