The 50 SMA Might Not Hold for Bitcoin
Bitcoin was finding support at the 50 weekly SMA earlier, but seems like this MA is turning into support
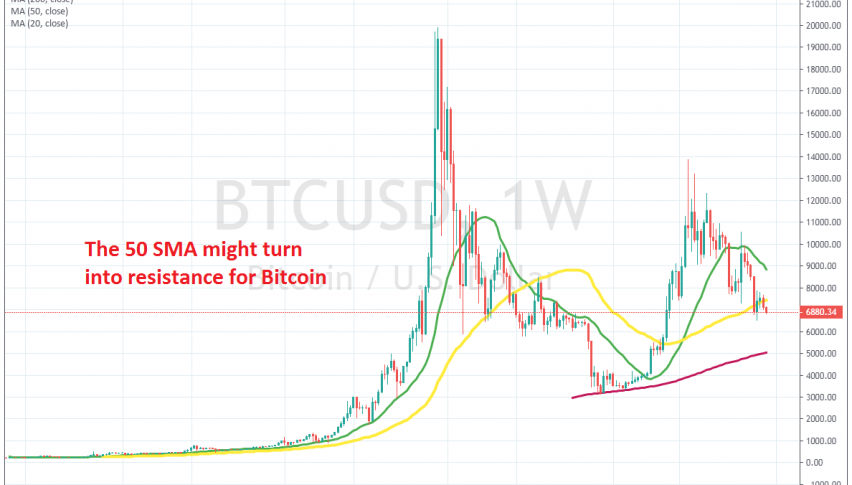
BITCOIN turned really bullish earlier this year, after having a pretty tough year in 2018. The price surged more than $10,000 in Q2, climbing pretty close to $14,000 in late June. But, after forming an upside-down hammer, which is a reversing signal, it reversed and started retracing lower.
The price was finding support at the $9,000 zone for some time and when the 20 SMA (green) caught up with the price, I thought that the uptrend was going to resume. But, that support zone was broken in September and the 20 SMA turned from support into resistance.
After failing to break the 20 SMA, buyers gave up and sellers pushed down to the next moving average. The price slipped below the 50 SMA (yellow) but returned above it, so at the beginning of this month, I thought that perhaps this moving average was the one to bring an end to the retrace and reverse the trend.
But, the price formed a small doji up there, which is a reversing signal. After that, a bearish candlestick followed, so the chart pattern points to further downside for this pair. Although, sellers will have to push below the previous low at $6,600 in order for he downside to continue. But, the longer Bitcoin stays below the 50 SMA, the more bearish the picture will look.
- Check out our free forex signals
- Follow the top economic events on FX Leaders economic calendar
- Trade better, discover more Forex Trading Strategies
- Open a FREE Trading Account
- Read our latest reviews on: Avatrade, Exness, HFM and XM
Related Articles


Sidebar rates
Related Posts
