Buying the Pullback in US Crude Oil
Crude Oil has been bullish for nearly 3 months and we decided to go long on this latest retrace lower today
Crude Oil has been on a bullish trend since early October, when it made a bullish reversal above the $50 zone. Rumours from OPEC that they might cut production again have kept US WTI crude bullish and it has moved above the big round level at $60, where it has been trading most of this week.
We did see a dive at the end of November, after the Russian Energy Minister suggested that another production cut from OPEC+ might not come until the middle of next year. But, OPEC decided to cut by an additional 50k barrels/day nonetheless, which has helped Oil prices remain bullish.
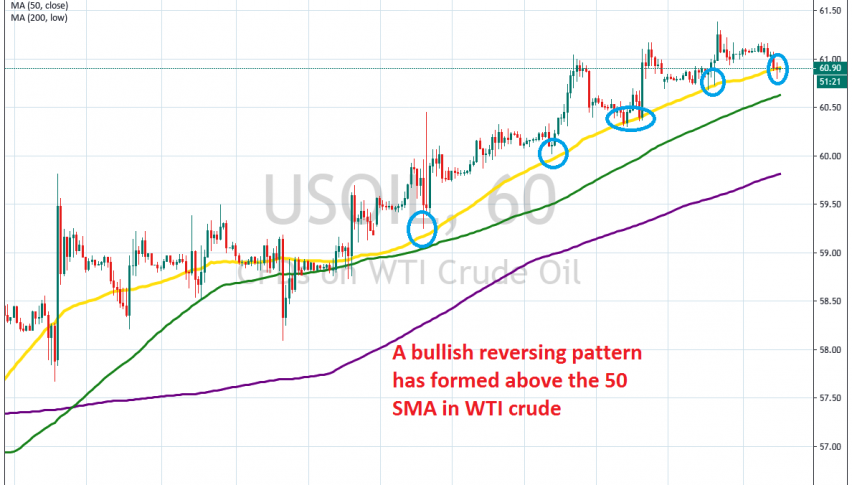
As you can see from the H1 chart above, the 50 SMA (yellow) has been providing support during pullbacks, pushing the trend higher, which shows that the trend is pretty strong. Right now, we are seeing another retrace lower, but the 50 SMA is still holding, despite a brief piercing. Now the pullback down is complete and the price formed a doji at the 50 SMA, which is a bullish reversing signal after the pullback. So, we decided to take this opportunity and go long from here.
- Check out our free forex signals
- Follow the top economic events on FX Leaders economic calendar
- Trade better, discover more Forex Trading Strategies
- Open a FREE Trading Account


