Sellers Remain in Control in Bitcoin as MAs Turn Into Resistance
Bitcoin has been bearish since June and MAs have been providing resistance, pushing it lower
Crytpocurrencies had a great time in Q2 of 2019. They were trading sideways in Q1 after having a terrible year in 2018, which was a sign that the decline had ended. Buyers were activated in Q2 and BITCOIN climbed more than $10,000, surging from around $3,000 to $13,750.
But, the climb ended at the end of June and despite a couple of attempts from buyers during the summer trying to keep the uptrend going, the highs kept getting lower, which showed that the trend has been shifting. The 100 SMA (green) provided support on the daily chart for a while in August, but it didn’t last long and the price fell below all moving averages.
The moving averages turned into resistance then. The 200 SMA (purple) provided resistance in September, while at the end of October, Bitcoin surged more than $3,000. But the 100 SMA did a good job ending the bounce and reversing the price back down.
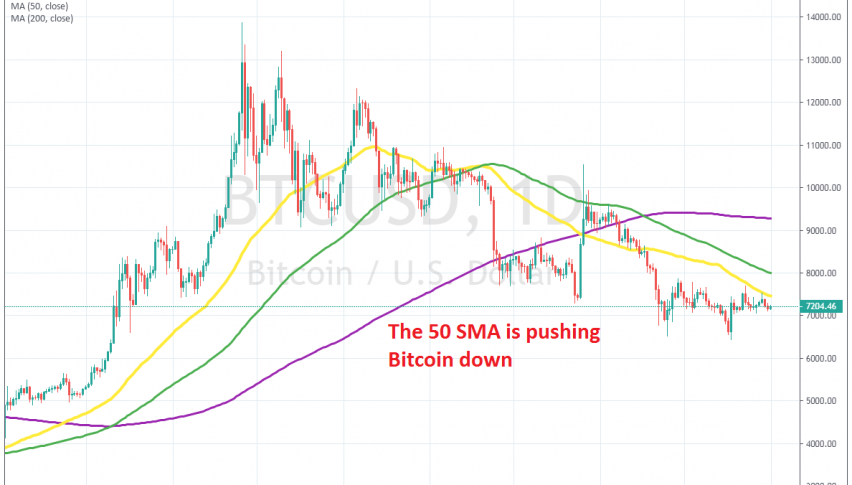
Bitcoin continued to slide and now the 50 SMA (yellow) has turned into resistance. This moving average provided resistance twice last month and is pushing the price lower now. So, as long as the price stays below moving averages and particularly the 50 SMA, Bitcoin will be bearish.
- Check out our free forex signals
- Follow the top economic events on FX Leaders economic calendar
- Trade better, discover more Forex Trading Strategies
- Open a FREE Trading Account